Tuesday, 24 October 2017

A New Direction

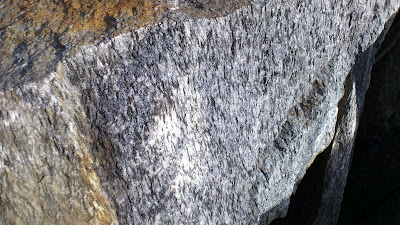
This blog has been rather neglected in recent years, but I am now motivated to wake it back up.  I have applied for, and been accepted to, a new PhD program. My first PhD was in geology, studying the Cambrian Metamorphic History of Tasmania.  My new field will be geo-archaeology, studying Viking Age steatite (soapstone) vessels. I will be analyzing examples of these objects from grave finds which display a variety of levels of status, with the hope of answering these questions:

  1. Can I determine from the composition of the stone used for the vessels where the stone originally came from? 
  2. Did all the vessels in each region come from the same source, or more than one source?  
  3. Did people of different status get their steatite vessels from the same sources or from different ones?

My enrollment will officially start in January, but I am so excited to be undertaking this project that I have already begun some preliminary steps (including waking this blog back up).  If anyone thinks this project sounds cool and would like to know more about Viking Age soapstone, I recommend the book, Soapstone in the North. Quarries, Products and People 7000 BC - AD 1700, which just came out this year, as a wonderful source for what is already known on the topic.

Tuesday, 2 December 2014

what is a femtosecond, anyway?

I have started a new job which will involve running a Laser-ablation ICP-MS. As a result I have been doing a fair bit of reading on the subject, and, in the process learning (and re-learning) a fair bit of stuff.  Today’s reading (Li et al. 2013*) included a sentence that said “Compared to nanosecond-laser ablation systems, the femtosecond-laser ablation systems provide significantly improved analytical performance…” (and it went on to list what some of those improvements were.  However, it was the first half of the sentence that caused me to come to a full stop and consult the internet for help—I didn’t have any idea what “femtosecond” means.  Clearly it is a unit of time, but how big is it, and is it bigger or smaller than a nanosecond?

Luckily, these days the answer is easy to obtain, checking any list of SI units and their prefixes will reveal that femtoseconds are much shorter than nanoseconds (and therefore faster is better when it comes to analytical performance of laser-ablation ICP-MS systems). The sequence of gradually smaller and smaller divisions in the SI system is: deci, centi, mili, micro, nano, pico, femto, atto, zepto, and yocto.  While I have probably seen this list many times since I was introduced to the SI system as a child, prior to today only the first five were familiar to me.  I already knew that there were 10 centimetres in every decimetre, and 10 millimetres in every centimetre.  I had memorized the fact that there are 1000 micrometres in a millimetre when first I started doing petrology, since it is fairly common to measure minerals in thin sections using micrometers.

However, while I knew the word “nano” meant “even smaller than micro”, that was as much as I knew—I hadn’t bothered to look up that it meant 10-9, which means that there are 1000 of them in every micrometer. The even smaller units I didn’t know at all. Femto is not just a little smaller than nano, it is two steps down the scale smaller: 10-15 means that there are 1,000,000 femtometers in a nanometer.  Or, if we switch back to the seconds that appeared in the sentence that triggered this diversion:

One nanosecond is to one second as one second is to 31.710 years.
One femtosecond is to a second as a second is to about 31.7 million years.

So it isn’t just faster, it is really, really, really lots faster.  No wonder one gets different results with femtosecond-laser ablation than one does with nanosecond-laser ablation.


*Li XC, Fan HR, Santosh M, Hu FF, Yang KF, Lan TG (2013) Hydrothermal alteration associated with Mesozoic granite-hosted gold mineralization at the Sanshandao deposit, Jiaodong Gold Province, China. Ore Geology Reviews 53:403-421

Saturday, 28 December 2013

vectors!

Back when I first started my current research project one of the goals my boss mentioned was to see if we could determine "vectors of hydrothermal transport", or "what were the paths the hot water took as it dissolved some rock components and deposited others?".  As of today, more than two years after starting this project, I finally have an answer for that for one of the ingredients in my rocks.  Why did it take so long to get here?

Well, to start with, the data set the mine gave me is rather large, and the information within it was entered into the data base at a variety of different times, and the method in which the mine recorded the position of the drill holes changed at some point, so it took months to get the data "cleaned up" to the point that I could get all of the sample locations plotting in the correct space in 3D.

Then it was necessary to use "immobile element ratios" to determine what rock type each sample is. Why? Because in an area where lots of hot water flowed through the rocks picking up some elements and carrying them away while depositing others none of the rock has the same chemical composition as when it formed. However, there are certain elements that tend to stay put in the rocks, no matter how much hot water flows through it.  These are called "immobile elements".  Assuming that we are correct about them neither being taken away nor added to the rocks then the ratio between them won't change.  However, the actual percentage of the rock that is made up of the immobile elements changes greatly. Why?  Because when the other elements are dissolved and carried off that leaves a higher percentage of the “immobile elements” in the rock than it started with (but there is less rock in total). Likewise, when other elements are deposited into the rock it becomes diluted, and there is a lower percentage of the “immobile elements” left (and there is more rock than there was to begin with).  In reality, both of these processes are happening at once, sometimes a bit more of one, sometimes a bit more of the other, but either way, the end result is a rock that, at first glance, looks nothing like the original rock.

However, as I mentioned above the ratio between the “immobile elements” doesn’t change. Therefore, all the rocks of the same type should plot along a straight line in a graph which has one immobile element on one axis, and another on the other.  This fact is used to recognize the various rock types in the area.

Once all of the samples (more than 3,000 in my case) have been sorted into their various rock types the next step is to decide which sample within each rock type is the “least altered” sample—which one has a chemical composition that is closest to what the rock must have been before the hot water started circulating through the area?

From there, assuming that the “least altered” samples really are pretty much the same as they were to being with, it is a reasonably straightforward calculation to determine how each of the samples has changed with respect to their least altered samples. Once this has been done for every sample one has a table showing the amount of each element that was gained or lost within each sample.

This information is then taken into the 3D modelling program I am using, which looks at the location of each sample, and for a given element it can then look at how much of that element each sample gained or lost, and then it goes a step further and makes an educated guess as to how the areas between the samples must have also changed, assuming a regular pattern.

I have been at this stage for a while now, and have created lovely figures showing which areas had the greatest gain in a given element, which adjacent areas had slightly less gain, which areas had no change, which areas had a little loss of that element, which areas had a greater loss, and so on.

But what I didn’t have was the “vectors”—the nice little arrows one can draw to say that the highs are here, and the lows are there, and this is the path from here to there.  Today, at long last, I discovered a way to get that using the 3D drawing capabilities within the program.  “All” one has to do is first rotate the full 3D models around on the screen, setting the various layers to various states of transparency, until one is satisfied one knows where one wants to draw the line.

Then add a “plane” to the screen that goes through the area one will want to draw the line. If it happened to appear in the correct spot in the first place, rejoice.  However, it is more likely that it will need adjusting.  There are several options for this—one can grab one of the “handles” provided by the program, and attempt to drag the plane up, down, left, or right, until it sits where one wants it to sit (don’t forget to rotate the image on the screen and look at it from multiple directions to be certain it really is where you think it is!). This is even harder to do than it sounds.  Another option is to turn off the plane and try again from the beginning. The third option is to look at the numerical coordinates for the plane and edit them.  This one can be the best option. If you happen to have a sample located near where you want the center of the plane then you can click on the sample to determine its X, Y, and Z coordinates, then type those into the location of the plane. Once it is centered where you want it you can then change the dip and the dip azimuth until it is oriented correctly.

Once you are happy with the location of the plane then add the “slicer” to the screen, and edit the coordinates of the slicer until it is in the exact same position as the plane.  Then you can rotate the screen until you are looking at the flat of the plane (and slicer).  At that point it is possible to add a “poly line”, drawing it from the area with the greatest loss in that element to the area of the greatest gain in that element (note: it helps if you have first set the 3D model to have the front half removed by the slicer—that way when you look at the plane of the slicer what you are seeing is the concentric shells of the model, so that you can draw that line).  Such poly lines automatically appear in the plane of the slicer, which is why those set-up steps were necessary.

Rotate the screen, did you get the line where you wanted it? Yup! Great. Go on to the next fault block and repeat the process from the beginning.  Tedious? Yah. Cool to be able to add lines in 3D? Absolutely!

One more goal achieved, and the clock is ticking—the project officially ends with the end of this year…


Monday, 23 December 2013

plants: cover or clue?

I haven’t played along with the Accretionary Wedge game in quite a while, but when I saw this month’s topic “rocks and plants” memories of my undergraduate field lessons sprang into my mind at once, so I knew it was time to share.

There are times in every geologist’s life where we start to resent the “cover” that plants and soil represent—when important contacts are obscured. When there are no rocks to be seen for many miles around. On the other hand, sometimes plants are a useful clue.  I remember when I was an undergraduate student on a field trip our teacher taught us to recognize his favourite plant, Aspidotis densa, a fern which likes magnesium in its diet, and so tends to grow on serpentine rich soils.  He worked in southern Oregon (and northern California), an area which often has serpentine located within fault zones.  In fact he said that many geologists he knows working in that area are inclined to put a fault on their map when doing field work if the only clue they see is a single outcrop of serpentine.  By extension, in areas with heavy vegetation and no rock outcrop whatsoever, if they see aspidotis densa they make a note of it, because it could mean there is serpentine present, and therefore this could be a fault zone, and they look for other clues (is there a spring that comes to the surface nearby also?).

It has been many years since I was an undergrad, I haven’t done mapping in that part of the world for a very long time, yet I had never forgotten the name of that plant, and, because I learned about it when I was young and impressionable, I always remember to ask local geologists when I come to a new area if there are any important local plants I ought to be able to recognize because they only grow on a specific soil type, and thus give clues to the geology they cover.

Tuesday, 8 October 2013

I think I have a new favourite rock type

I spent most of last week at the Metamorphic Geology Field Symposium in Halland, SW Sweden, and can enthusiastically say that this was the best field trip/short course/conference I have ever attended. The outcrops were stunning, the lectures fascinating, and the discussions engaging.  All in all I am very, very inspired to pursue research in metamorphic geology once again. The project I have been working on for the better part of the past two years is tangentially related to metamorphic petrology (the rocks have undergone metamorphism, but that is not terribly relevant to the project goals), and it has been interesting, but from here on out I would like to have my research even more closely aligned with my metamorphic interests. But that is not what I am here to talk to you about.
Kyanite eclogite!  There is a place in the south west corner of Sweden where there are lenses and layers of kyanite-bearing eclogite within a deformation zone. The zone is, specifically, the Gällared Zone, which, they tell me, is the northeastern most part of the Ullared Deformation zone as defined by Möller et al (1997).

Due to the deformation in this area some of the eclogite has been transformed into high temperature mylonitc gneiss, but there are still a number of areas where the eclogite itself has survived. Within these areas are veins where the kyanite is so abundant that instead of being a green-red normal eclogite the rock is a striking blue-red combination that is so beautiful I thought it worth taking the time to put my fingers to keyboard and do some bloging for the first time in months.
The field guide for the trip tells me that the presence of kyanite in rocks that have experienced eclogite facies metamorphism indicates that the pressures would have been greater than 15 kbar at a temperature of 700 C, and the paper by Möller (1998) contains a great deal more information about the composition of the various minerals in these rocks and what those compositions mean in terms of the temperature and pressure at which they formed.


REFERENCES:

Möller , C., Andersson, J., Söderlund, U., and Johansson, L., 1997: A Sveconorwgian deformation zone (system?) within the Eastern Segment, Sveconorwegian orogen of sw Sweden – a first report. GFF 119, 73-78. DOI: 10.1080/11035899709546457 

Möller C (1998) Decompressed eclogites in the Sveconorwegian (-Grenvillian) orogen of SW Sweden: petrology and tectonic implications. Journal of Metamorphic Geology 16 (5):641-656

Tuesday, 26 February 2013

luckily, my geo-injuries have been minor


When I first saw the call for Accretionary Wedge 55 I couldn't think of any injuries I had gotten in the field, and closed the tab on my browser and thought nothing more of it. However, today, reading some other reports of minor injuries, I suddenly remember a rock-related owie.

I was an undergraduate geology student, living in southern Oregon. My boyfriend at the time decided that since I liked rocks and was new to that part of the country he should take me on an adventure to the Lava Beds National Monument to do some caving in the lava tubes there.  As far as dates to take geologists go, this was a very good idea.

So there we were, wandering through a lava cave, the only light coming from my headlamp and his flashlight. He scampered up a small pile of lose rocks, each perhaps 10 to 20 cm in diameter, and I started to follow. However, in so doing I discovered that the density of vesicular chunks of lava is very different from the more solid rocks I had encountered elsewhere, and as a result they rocks shifted under my feet in a very unexpected manner.  I lost my balance and fell forward, catching myself on my hands.

In the process the little finger of my left hand got caught between two rocks. When I called out, more in surprise than pain at that point, my boyfriend returned to my side, asked to look at my hand to see if it was ok, and, seeing that my little fingernail had split lengthwise, and that the outer portion was pointing off at a wrong angle, decided that the time to fix it was before I noticed that it hurt, so he grabbed my hand and pushed the nail back where it was meant to be. That got me to exclaim in pain!

That pretty much cut short the adventure part of the day—instead of exploring further we went back to the visitor center, cleaned the wound and got it bandaged up.  Thanks to his prompt re-alignment of my finger nail the wound healed cleanly, and I never lost any nail, though it had a bit of a seam running the length of it for a few weeks.

Monday, 18 February 2013

Book Review: Metasomatism and the Chemical Transformation of Rock


Last April I heard about a soon to be released textbook that sounded very interesting and useful to my current research project: Metasomatism and the Chemical Transformation of Rock, edited by Daniel E. Harlov and Håkon Austreheim (published by Springer).  I checked out their web page, and saw that it would be possible to obtain a copy for review, so I filled in the form and sent it in.  In September I received an email letting me know how to access my copy on line, and I have been happily reading my way through the book (in between my other duties) ever since.  Now that I have (mostly) completed the reading, it is time to sit down and type up the review.

First of all, I am pleased to note that sometime between when last I read a textbook and picking up this one the fashions in how they are organized seems to have changed—this book starts with a chapter that summarizes what can be found in all of the subsequent chapters. I think I like this new trend, since it makes it easier for a busy person to decide which chapters they actually need to read based on what is and is not relevant to their own research.

The introductory chapter also provides a concise, clear, definition of metasomatism and an explanation of how it is both related to and different from metamorphism.  Metamorphism refers to the changes in rocks due to changes in physical conditions (primarily heat and pressure) which may or may not involve a change in composition of the rock. This is a subject I am well versed in, having done metamorphic research in one form or another for more than seven years now. Metasomatism, on the other hand, refers to changes in the composition rock due to interactions with an aqueous fluid, which picks up some elements and deposits others.  This is clearly related to metamorphism, but while they overlap, they are not the same.  It is also the major process affecting the rocks in my current research area, which is why I was so happy to see the book come out just now.


For the most part I have been very happy with this book—it takes a variety of different threads and ties them together in an easy to understand package.  Indeed, I have so enjoyed some of the discussions that I have taken longer to read the full book than I might otherwise have, since I stopped so often to look up and read references cited—something I don’t recall ever doing when I was an undergraduate student reading textbooks because they were required for a class.  

The list of chapter authors includes names that will be familiar to anyone who has been reading papers that address aspects of metasomatism (see above link for the table of contents). My personal favourite chapters were the ones on thermodynamic modelling, the effects of metasomatism on their host rocks, and on geochronology.  I found the one on thermodynamic modelling fascinating since I am already familiar with doing that for metamorphic rocks, and it was interesting to read about what needs to be considered when one assumes that the bulk rock composition DID change, as it does with metasomatism, but as it does not (necessarily) do with metamorphism. The chapter on effects is particularly useful for me because this is information I need for my current research, and I enjoyed the geochronology one because I did a fair bit of geochronology for metamorphic rocks for my PhD research, and it is interesting to see how one approaches it differently for metasomatic environments.  

I did notice some minor issues with the editing on a grammatical level, which surprised me, since I would have assumed that a major publisher would have good editors on staff whose job it is to prevent such things. They were just little things that caught my eye and grated a bit on my nerves as being awkward and clunky (I think that the phrase "…presence or not of fluids" should have been written "…presence or absence of fluids”).  However, such details do not actually detract from the content, which I am finding to be very useful.


I am also pleased to pass on the news that the authors of this book have recently presented a short course at the 2012 Goldschmidt conference.  They have shared the pdfs of their presentations for this course on line.  I would have loved to have attended the workshop, but since I wasn’t able to make it to the conference I am delighted that they have this handout available—it appears to compliment the book very well.


Friday, 15 February 2013

Three broad roads a geologist might travel during their career


There are several different paths a geologic career might take: academia, exploration, or environmental/risk. Which one is best for you will depend on your personality type.

A geologist in academia is usually someone who studies rocks to better understand the information recorded in them—how and why did they achieve their present composition and/or configuration?  They start with what they know: the rock is located here and looks like this, and extrapolate from clues within the rock to determine how it got there, and why, and when, and what happened to it along the way.

An exploration geologist, on the other hand, is looking for something (often oil or mineral resources).  They don’t know where their commodity is located, so they study locations where similar such resources have already been found to look for patterns to the rock structure and/or composition that they may be able to recognize elsewhere and so find what they seek in a new location.

The third category of geologists the environmental sector and/or risk management.  Their job is to understand the dangers which are present in our world, and look for ways to prevent those dangers from becoming problems.  They start with the facts that are known (e.g. the presence of contaminants in the ground water at point A, zones of weakness in rock that could lead to landslides, or the location of an active fault or volcano) and play “what if” games to determine how much (or what manner of) danger these present to the people in those areas.

So, which are you? Are you more interested in asking question of “how/why/when”?  Do you want to know “where”, or are you more concerned with “what if/how can I help”?

For myself I am pleased to be in the academic track—I want to better understand the world around me. I am not interested in playing games of hide and seek—I don’t even care to go shopping because I don’t enjoy trying to figure out where to find something I need is located.  Often the stores don’t even carry what I want and I waste valuable time looking for it, a parallel which is probably all too familiar to exploration geologists—not every search they undertake leads them to a discovery.  However, I suspect for those who do enjoy a good search there is an extra reward in terms of satisfaction when their work does lead them to what they seek.  

I am also far more interested in understanding how the rocks got to where they are now than I am in understanding what dangers they present to humans.  While I am very aware that it is vital that someone is working to keep contaminants out of ground water, or tracking them once they are there so that no one is using the bad water, I don’t want it to be me.  While I am grateful that I know enough not to build my house right on top of a fault zone or in the path of a potential landslide, I don’t wish to be the one who has to warn others about these dangers.  Adding in a human element presents all kinds of extra challenges and complications that I am happy to leave to others.  But my biases are not yours, and you are likely to have different interests and different reasons to find one of these paths more or less appealing than the others.

Thursday, 17 January 2013

A challenging way to write


I was inspired by Ann and Chris over at HighlyAllotchthonous to try to write up what I study using a text editor which limits one to using only the 1000 most commonly used words.

Here follows my attempt to describe metamorphic petrology and 3D models of hydrothermal alteration systems using none of those words:

I study rocks that have changed because they got hot or because too many other rocks were on top of them. The bits that make up rocks can change quite a lot because of just how hot it is, and also because of how much stuff is on top of it.  Different bits of rock like to give away some the stuff they are made of when they get hotter (and/or they go deeper under other rocks), and instead take different stuff from other rock bits.  Studying which stuff appears more in one rock bit than another rock bit can tell us just how hot or how deep the rock must have been. 

Another thing which can make rocks change is water. When hot water moved through the cracks in rocks it can help carry stuff between the rock bits.  My job today studies rocks that had water help them to change, and I am trying to make a drawing that shows all of the changes as they happened-a drawing that one can look at from any side: top, bottom, left, right, front or back. When the drawing is done you will be able to turn it any way you want and see how the rocks have changed.

Thursday, 6 December 2012

New toys are inspiring


I have always been a visual person, and one of my favourite parts about being a petrologist is the pretty photos of thin sections that I have collected.  I also love organizing stuff—I was one of those kids who had even more fun sorting my legos by colour, size, and type than I did actually building things out of them.  However, until this week, it had never occurred to me that it would be possible to do visual organization of my photos.  Oh, sure, I had some organization of my sample photos—a folder for all the thin section photos, and sub folders for each sample. Another folder for photos of drill cores, with sub folders for each drill hole, and under those more sub folders for each box of core (since when using my phone I need to take nine photos per tray of core in order to photograph every bit of it.

But that was where my organizational system stopped.  If I wanted to do something like, gather together all of the rhyolite samples and look to see if they were similar or different to one another I would open the spreadsheet of samples, sort by rock type, then, one sample at a time go through the folder of photos for each sample, import it into my drawing program, add text, insert a new page for the next sample, repeat.

Then I read a blog post by my favourite medieval textile scholar describing the photo organizational database she uses.  She mentioned that one can store photos in a folder yet, at the same time, have “albums” to organize them, and the possibility of one photo belonging to more than one album, without duplicating the photo. Her description of being able to define smart albums based on key words associated with the photos caught my attention, so I went off and got a copy of the program.

Doing this has really re-inspired me to work. My partner and I recently bought a house, and a rather large part of me had been resenting “work” as something that was interfering with important things like getting the house unpacked and organized, and exploring the forest outside of our door.  But now I am keen to come into the office and play with my photos and organize them. I am actually looking forward to writing papers, because choosing the right image to show the feature I describe in the text will be so easy with this tool.

So far I have created albums for each drill hole, and sub albums within the drill holes for the individual samples. I have copied all of the notes I took for each sample into the album description, so I can see at a glance which phases are present, what rock type I assigned the sample to, where the sample comes from, and so much more.  I am adding key words to my samples so that I can later ask to see all photos containing feldspar, or pyrite, or whatever, and I will get them.  The program lets one select multiple photos at once and apply key words to them all at one go, which saves time.

One bit of advice if you decide to do something like this:  Decide on your key word pattern as early as possible.  My photos are marked with a variety of types of key words, and my first attempt I just typed in useful words like “PPl”, “XPL”, “folded” “Qtz”, “10X” etc. But then I realized that one can add key words from a drop-down menu, which is sorted alphabetically.  After I made that realization I added a type code to the front of the key words, and now I can specify if the key word is a “drill hole”, the “scale”, a mineral (“min”), a phase that only shows up in this sample as inclusions within another mineral (“inc”), the rock type, structure, or any number of other categories that I will come up with later.  This makes choosing the keywords much easier, as they are now grouped together, so I can click on the one I need.

Monday, 17 September 2012

Importing Air Photos into Leapfrog


Some time back I received some air photos of the region I am currently working in from one of my colleagues. Last week I discovered that it is possible to easily import those photos into the program Leapfrog and thus see the lay of the land with respect to the locations of the various drill cores. However, he gave me six different photos but I only received corresponding “.tab” files for three of them. It is the data in the .tab files that tells the program how to import the photos—where are they located.  Therefore I set myself a quest: work out how to create .tab files for the other photos.  Having learned a number of things in the process, I thought I would share them here.

Step One in the process is deciding what points you want to use as markers.  Choose a place on the photo that is easily recognizable (like a cross-road intersection).  Then open GoogleEarth in one window and the air photo in another (using two monitors at once really helps!).  Zoom in to the selected location in google earth, and click on the thumb-tack shaped icon to get a marker. Drag that marker to where you want it, and give the marker a name (such as “T-intersection, upper left corner of Airphoto_a.jpg”), and save the location.  You can now look up the latitude and longitude of this point by clicking on it and selecting “properties”.

Step Two is to use an on-line form such as this one  (option: “Transverse Mercator Calculator”) to convert the latitude and longitude into the Swedish national grid known as RT-90 (that is the format of the drill hole locations with which I am working—if you are working in a different area you will need to instead convert to the appropriate coordinates for your area).

Step Three is to determine the X-Y coordinates on the photo itself of the selected location.  First look up the size of the photo by importing of it into Leapfrog without worrying about the fact that there is not yet a .tab file for it.  Then right-click on it to open the properties dialogue box and make note of the photo size (mine happened to be 1404 wide and 940 tall). (It is a good idea to now delete the photo from Leapfrog, since it is not, yet, in the correct spot). Now that you know the photo size that Leapfrog will be using, import the photo in CorelDraw, and change the size of the photo to those values.

Now you are ready to for Step Three itself: Use the “guidelines setup” dialogue box of CorelDraw to create two guidelines, one horizontal, one vertical, both located at zero. Then turn on the “snap to guidelines” feature and set the photo so that the upper left corner of the photo is located at the newly created 0,0 intersection.  At this point it is a good idea to “lock” the layer the photo is on so that you do not accidently move it during subsequent measurements.

Now that the photo is properly positioned drag new guidelines onto the photo such that they intersect at the spot you selected in Step One. Re-open the “guidelines setup” dialogue box and edit the position of those lines to the nearest whole number (e.g. 57.3456 becomes “57”) and look at the revised position to be certain you are happy with the location of the intersection of the guidelines.

Step Four: edit a .tab file with the numbers determined in Steps Two and Three.

The files he gave me have this format:

****************************
!table
!version 300
!charset WindowsLatin1

Definition Table
  File "airphoto_kriberg_a.jpg"
  Type "RASTER"
  (X,Y) (A,B) Label "Pt 1",
  (X,Y) (A,B) Label "Pt 2",
  (X,Y) (A,B) Label "Pt 3"
  CoordSys Earth Projection 8, 112, "m", 15.8082777778, 0, 1, 1500000, 0
  Units "m"
 ****************************

Where X and Y are the east and north coordinates of each spot in the RT90 format (Step Two) and A and B are the positions on the photo itself (Step Three).  Edit this to have the numbers you determined above, and repeat for two more spots on the photo.  Save as a .tab file in the same folder as the photo itself.

Step Five: import into Leapfrog.  If you edited the .tab file correctly choosing the “import image” option will open up a dialogue box that shows a circle, a square, and a triangle each superimposed over the photo on one of the three points of interest you selected. If they are in the correct spot click “ok” and your photo is imported.  If you don’t get a dialogue box but only an error message one possibility is that you could have introduced a blank space after the coma and before the next number. This is easily solved by deleting that space.

There may well be a simpler way (more automated) way to create .tab files for importing air photos into Leapfrog. If anyone knows of one do please share in a comment.  In the meantime writing down what I did will help me remember next time I need to do this.

Monday, 30 July 2012

Tasmanian Metemorphic Geology; It is wilder than you think.


This morning I received comments from reviewers on the manuscript I recently submitted.  I was delighted to see that they recommend that the article be accepted, after minor revision.  Even more than that, I am very happy that one of them took the time to actually read the text closely enough to catch some important typographic errors.  Of all of them that he found, my favourite is:  "...rocks wildly distributed throughout Tasmania". 

While, I have, on occasion, used the term “in the wild” when referring to rock types I have personally seen on a outcrop in the field (as opposed to in a rock collection in a lab or museum), I am quite certain that what I was thinking when I typed that phrase (and must have thought I saw on every subsequent re-read of the manuscript) was “widely distributed”.  My thanks to this reviewer, and to all reviewers who take the time to be certain that such errors never make it to the published version of a document.

Friday, 27 April 2012

What about GeoSociety journals?


There has been a fair bit of attention recently in the media and on science blogs about the evils of the academic publishing industry and how much profit the publishers get for all of the unpaid work that scientists provide in terms of writing, editing, and reviewing the content, combined with a cry for academics to consider publishing instead in open access journals.  This suggested solution makes a certain amount of sense to me, but I find myself wondering about the journals which are associated with Geologic Societies (for example the Australian Journal of Earth Science, which is available to members of the Geological Society of Australia, or Elements, which is available to members of number of Mineralogical societies in a variety different countries).  These journals are not open access, but the memberships base of the societies are, sometimes, very extensive, and some of these societies have reasonable membership rates.

For those of you who are actively participating in the boycott of journals which are hidden behind a pay-wall, how do you feel about journals which are associated with such societies? There is still a pay-wall, and in some (all?) cases there is a professional publisher which does the publishing on behalf of the society (Taylor & Francis and GeoScience World  for the above two examples).  Does the fact that the journal is one of the perks to membership in the society help alleviate the concerns about paywalls?  Are these sorts of journals handled any differently than those which are only for profit of the publisher?

I am wondering about this because I am just about ready to submit an article for publication, and the most logical journal for that particular research happens to be AJES. Therefore I would appreciate hearing other people’s thoughts on this subject.

Wednesday, 21 March 2012

yet another academic publishing blog

I have seen a variety of other blogs discussing the problems in the academic publishing system, with many discussions as to *why* the system is continuing to thrive, depsite the presence of the internet having rendered most of the services provided by publishers obslete. However, none of the discussions which have crossed my path address what, to me, is likely the biggest reason. As scientists our publication records matter—if we don’t have “enough” first-author papers published we don’t land jobs in acaidmeia, and we don’t get grants if we have jobs. The universities for which we work are ranked, in part, by the number of publications we produce, and the quality of the journals in which we publish. The more “A” ranked journal articles produced by a given university, the better it is considered to be, and the easier time it has of getting funding. So long as funding decisions are based, in part, on our list of publications, and so long as the prestiege of the journals in which we are publishing matters, the system will continue to thrive, despite so many of us being unhappy with it. Is there hope of this changing? Perhaps, if enough people want it to change.

Tuesday, 20 March 2012

Geology field trip at Arlanda airport


The next time you have too many hours to wait for your next flight at Stockholm-Arlanda airport why not step outside and have a short geology field trip?

I had a long layover on my way to France, and it was much too nice of a spring day to spend the wait inside. The first thing I noticed when I stepped outside is that spring in southern Sweden is much further along than it is in the north. At home the snow was still fully covering the ground, though starting to get soft and melty. Down here there is no snow left at all, though the flattened, yellow state of the grass attests to the fact that there was snow on the ground fairly recently.ere is

I set out from Terminal 5, following the bike/walking path to the
left from the building (note: use the exit on the lower floor; the sidewalk on the upper level dead-ends at the top of the driving ramp to the loading zone). I found the first outcrop straight away: a tall chain-link fence protects unwary travelers from falling over the edge of a small, man-made cliff.


Not being able to resist the allure of a fresh rock surface, I promptly left the trail to investigate. The cliff is actually a channel cut into the rock which ends at a large garage-door.


The rock here is fine grained, dark, and contains small veins, some of which cross-cut one another. The weathered surface shows a bit of foliation to the rock.


The astute observer might notice that along the fence edge there is a bunch of rubble fill which is made up of a coarser grained white rock with elongate black grains showing a foliation.


However, the wait for my flight was quite a long one, and I still wanted to stretch my legs, so I decided to continue my exploration. I continued following the path, turning left at the Statoil station and continuing along the path towards the forest in the distance.

After a short walk I came to a body of water which had an earth-bridge crossing it, leading towards a small hill with rocks exposed at its peak.


What geologist could resist? Closer investigation revealed the source of that white and black rock that is being used as fill everywhere between here and the terminal.


There are plenty of fresh surfaces to admire, sparkling in the sunlight on the side that has served as a quarry.


There are also plenty of examples of how the rock looks 'in place' on the other side of the hill.


It took me only 35 minutes to walk from my gate to the quarry outcrop, and I recommend the adventure to other travellers with time to spare who would rather enjoy fresh air and investigate the local geology than explore the over-priced airport shops.

And to show how far apart the two outcrops are: The view back to terminal from the further outcrop:

And how close the nearer outcrop is to the same control tower:


Thursday, 8 March 2012

WoGE # 334


I have been seeing various posts from the Where on GoogleEarth game wandering hither and yon over the geoblogosphere for years now, but never really felt like I had time to play. I did once open GoogleEarth and spend something like 1 minute looking around before deciding that my time that day would be better spent actually doing the tasks for which I had turned on the computer in the first place. Yesterday, however, I decided that it was time to actually give it a go, so when I saw Zane’s post announcing #333 and noted that no one had yet posted an answer (though Florian at EffJot had indicated that he was only waiting for hi

s Sc

hott rule time period to elapse before he posted his answer), I downloaded GoogleEarth (no, I hadn’t gotten to that yet—I only got this computer in November, and hadn’t yet needed it—for quick looking GoogleMaps is adequate).

Now, I was lucky with this one—coast lines narrow the search quite a bit, and the style of agriculture and architecture looked sort of English to me, which meant I could focus my search on Britain and places colonized by them. Even so it took a while to find the location, at the mouth of the Wairoa River in New Zealand (North Island). Once I found it I refreshed the page and saw that there were no new comments, so I started a comment of my own,
describing the location and geology. Now, since I am not a sediment person this means that I also spent a couple of minutes consulting with google to find a paper on the geology of the area, so that I would have something to say on the topic.

Once I was done I hit the button to post the comment, only to discover that Florian’s answer had appeared nine minutes before mine. It was a fun game, but I lost, fair and square, and I was quite delighted to have been able to find the location on my first try of playing. However, Florian, being a generous soul argued that given the closeness of the timing of the posts the win (and obligation to host the next one) should go to me. Astute readers will
note that since he had been waiting to post until his time limit was up it wasn’t, truly, that close—he knew the answer before I started looking. Be that as it may, after a bit of discussion he and Zane both agreed that I should take the next go at hosting.

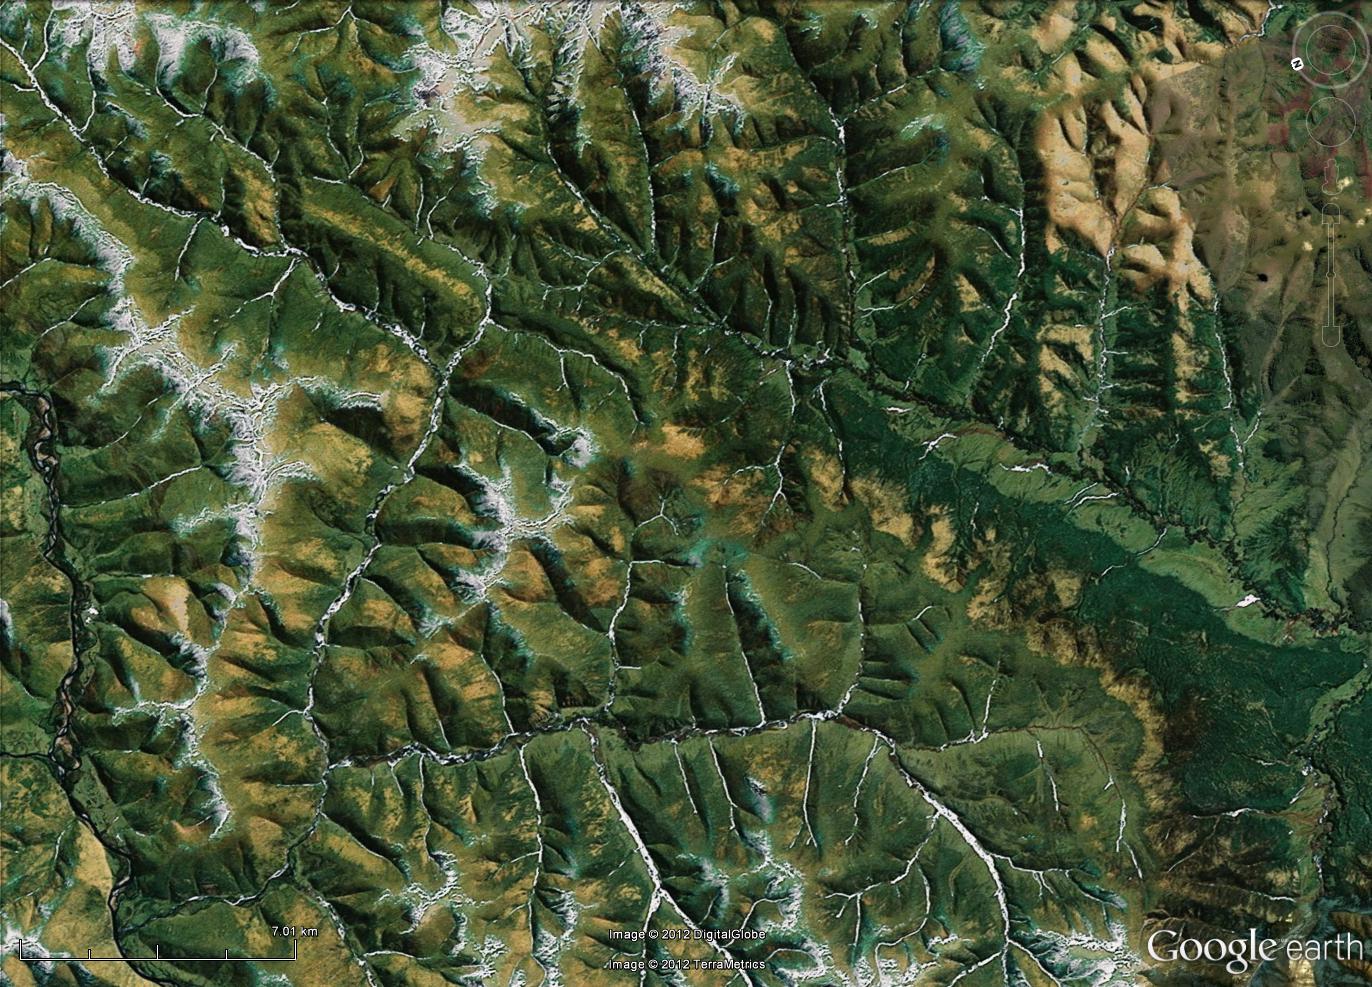
Therefore, without further ado, I introduce you all to Where on GoogleEarth #
334:


I am looking forward to hearing what you can tell me of the geology in this area—from the little I read before selecting this spot you should be able to share some interesting tidbits. Since I directly benefited from the Schott Rule it seems fair to not invoke it this time, so, come on you multi-winners, show us how it is done!

The scale bar, which I drew onto the above image myself, is roughly 5 km long; I didn't know how to get a scale bar to appear automatically in GoogleEarth. Fortunately, it turns out that there are instructions available for these things. Pity I didn't think to look for them before posting this morning. Oh well, this is why it is possible to edit posts.


However, when I made the above image, by using the handy "snip tool" on my computer and saving to jpg, adding a scale bar in a drawing program, and re-saving, the result turned out not to be clickable to make a larger image. Thanks to the below comment, I now know that one can save right from GoogleEarth (see, I told you I wasn't very experienced with the program, it didn't even occur to me to try). The new, improved image is below. Hopefully this time it is possible to zoom in enough to see details.


Nope, not yet. Perhaps I am doing something wrong in blogger when I upload them? At least it has the scale bar, which is 7.01 km long, since I couldn't get enough accuracy with the mouse on the slide bar to get it to stop at 7.00 km. Thanks to the kind help of Florian (see comments) there is now a full size version available over here.

Tuesday, 6 March 2012

writing grant proposals gives the writer more benefits than just the potential money they represent

My focus the past few weeks has been preparing a grant proposal. This is my first attempt at a major, multi-page, grant proposal. I have done minor proposals in the past—the field work for my master’s project was funded with a small GSA grant, and I have obtained a fair few travel grants over the years. Indeed, before submitting this proposal I was in the happy place of being able to truthfully state that I have received 100% of the grants for which I have applied. Needless to say, in addition to wanting this proposal to be successful because of what it would mean to my ability to do science (many of the steps in the process are expensive), that past success rate means that I am even more keen to have this application succeed, since it would be lovely to keep the 100% successful rate for a bit longer.

What have I learned about the grant-writing process? Well, for starters it is very good that I did the initial submission of the application a full week before the deadline, even though I knew that I did not yet have all of the information from my boss that I needed. Why? Because I had forgotten, until I saw that section of the webpage, that a grant application, like job applications, require letters of reference. By doing the submission of the first draft of the paper a week early it gave me the opportunity to remember that important detail, and to contact my referees to ask if they would be able to write a letter before the deadline. How would I have looked if I had had to write to them with only a few hours to spare before the deadline? (Note: the letters of reference have the same deadline as the application itself. If they don’t get it in by then their words will not be heard by the review committee. However, the web page is kind enough to email us applicants when our letters of reference are uploaded into the system, so that we know that they are done and don’t need to worry about that part.)

What else have I learned? There are three sections to the application packet. The first is where you describe the planned project: why it is scientifically interesting and why humanity will benefit from the project. The second is where you describe the scientist(s) who will do the research (that would be me, in this case) and explain why my background makes me the perfect person to do this particular research, and the third describes the institution at which the research will be conducted and why it is the perfect place to undertake such a project. Not surprisingly, I found the first two sections easier to write than the third, since I am so new to this institution. Fortunately, my boss was able to provide me with much helpful information to make the third section come together as it should.

I think that the thing which most helped me with this grant application process is all of the many job applications for academic positions I have done over the years since my PhD first started to draw to a close. The two processes are very similar. However, all in all, I think I have a preference for writing grant applications to job applications—there isn’t quite as much riding on it. If I don’t get this grant I still have a job, I still continue to eat and have a roof over my head. In this particular case I even still get to do the research I speak of in the proposal, since this grant is aimed at researchers who already have an employment contract and a project in progress, but wish additional fund so as to improve the list of what they can accomplish in the process. This level of security permits me to be happy about what I have accomplished over the last few weeks of working on the application—I now have an even better understanding of what my research will entail and how and when I will accomplish various tasks. Even if for some reason my grant is unsuccessful I still gain immense benefit from the process of writing up that work plan and the abstract saying what I will be doing. Besides, you never know—mine might be one of the applications chosen for funding. If I didn’t ask they wouldn’t be able to tell me ‘yes”.

Thursday, 1 March 2012

not late at all, measuring with a geologic time scale


As the rest of the geoblog sphere is busy offering up their entries to this month's Accretionary Wedge, I am finally able to offer my entry for last month's call.

Why a month behind? Because the call went out while I was in Scotland, and the counter top, ok, floor, I wanted to photograph was in Sweden. So I had to wait till I got home, and then I had to wait another couple of weeks before I found time to head to the city center to get the photos, and then I had to wait till I had time to actually upload them. However, I think you will agree that this particular building stone was worth the wait.

This is the floor at my eye doctor's office, and what a lovely floor it is. Look at the garnets! Look at the banding! I would love to know the location of the quarry that produced this rock.

Wednesday, 25 January 2012

a new (to me) sort of sample collecting

Sample collecting. It is something that we geologists have all done. It isn't enough to look at rocks in the field, we need to bring them home too, if we want to answer the questions that come up in the field. My current job, however, doesn't yet have field work in the traditional sense. Instead my “field” is the collection of drill cores which have been amassed over years of exploration and mining in this district. I have just completed my first two “field” trips to look at this core, which is to say I have been introduced to the core storage shed at the mine headquarters. Last week and the week before I worked with one of the geologists in the exploration division of the mine office. We looked at four different drill cores to select representative samples at roughly 50 meter intervals to be sent away for geochemical analysis.

This is an interesting task—my project will involve 3D geochemical modelling with the aim of understanding the alteration that has happened to the rock in the region during the process of the formation of the ore deposit. Therefore we need to be certain the samples we choose have been altered, but that the alteration that has taken place in these rocks is related to the main alteration event of interest. Therefore we want to avoid the sections of drill core which contain small veins which cut across the fabric of the rock (which means that they formed well after the deformation that caused the main rock fabric, and so are younger, and so probably aren’t related to the question I am trying to investigate). Because my project will be on the kilometer scale we don’t want to take the samples too close together (hence the 50-meter interval rule of thumb), but then again there is value in making certain that we have a good representative collection of samples that actually show what rock types are present in each drill hole.

This is easier to do for some drill holes than others. You see, drill core comes in different diameters, based on a variety of factors when they do the drilling, but the boxes into which they store the core are fairly uniform in size. This means that one box will hold more meters of narrow core than it will wide core. We sampled 4 different drill holes over the two weeks I was there—the narrowest core tended to be 10 or 11 meters of core per box, but the widest one was less than 5 meters of core per box (the other two were about 7 meters each). The tables upon which we spread the boxes hold 10 boxes at a time, which means we could view 50, 70, or 100 meters of core at a time. Needless to say, it is much easier to decide what rock types are “typical” for a given stretch when we can see more of the core at once.

Friday, 30 December 2011

"Directly" experiencing Subduction-Zone processes

I haven’t made time to participate in an Accretionary Wedge for a long time, so when Ron Schott called for the "Most Memorable/Significant Geologic Event That You’ve Directly Experienced", I thought it was about time to come out and play this game again.

In his call he gives some examples of a few processes that take place in human observable time frames and at surface pressures and temperatures (e.g. earthquake, landslide, flood…) and he repeats the part of his challenge about our being able to directly observe and experience the process we write about.

However, the sorts of geologic processes which most fascinate me are not those which create sediment at the surface of the earth, nor yet processes which produce fine-grained igneous rocks. To my eyes the most significant geologic processes are those which are responsible for creating the pretty rocks that drew me into geology in the first place—the ones with beautiful large crystals. Metamorphic processes, and also igneous processes when they take place deeply enough to permit significant crystal growth, are my favourite of all of the many geologic processes. However, the pressures and temperatures which are responsible for making particularly pretty rocks are well in excess of what our frail bodies can tolerate, which means that the process isn’t something I can ever "directly experience".


Or is it? How can we ever know what is happening within a subduction zone?


This question was not only of interest to me, but also to the international research team I joined when I began my last post-doc position. While none of us could go down the subduction zone ourselves to find out what was happening there, we were able to bring a tiny bit of the subduction zone setting into our lab.

Using a piston cylinder apparatus I regularly performed experiments which match the sorts of pressures and temperatures one would find if one could enter a subduction zone. While real rocks can spend millions of years working their way down a subduction zone and then back up again, I only held my samples at high pressure and temperature for two to four weeks at a time. As a result the crystals I grew from my powdered starting material did not achieve the large, stunningly pretty, sizes one can find in metamorphic rocks, but they did grow up to 100 µm in length (remember that there are 1000 microns in every millimetre), and many were lovely to look upon in the BSE images.

Having had the opportunity to perform such experiments I confirmed for myself that yes, pressure and temperature do matter to the minerals in a rock. If one takes the exact same starting material and "cooks" it at different settings one will get a different assemblage of minerals for each combination tried.

The below images show some of the results for one of the compositions I tested, at three different pressures (2.65, 2.8, and 3.0 GPa), and three different temperatures (600, 625, and 650° C). As you can see, the sets of phases present are very different for each experiment. Even the phases which are present in all experiments are present in different abundances when the pressure, temperature, or both are changed.

The few photos I have shared with you today are just a glimpse some of the experiments I have done. All of them together have transported my imagination to the depths of a subduction zone, and brought the merest hint of a subduction into my lab. This is "directly experienced"enough for me.


List of abbreviations:

grt = garnet

mu = muscovite (or other white mica)

qtz = quartz or coesite*

ctd = chloritoid

anth = anthophyllite

tlc = talc

*In all cases the SiO2 phase is labelled "qtz", even when it is at pressure high enough for that phase to probably be coesite—the microprobe does not differ between those two phases, and I did not check it with another technique (such as Raman) because the difference between quartz and coesite wasn’t relevant to my work, which was focused on questions related to the stability fields of talc, biotite, and garnet.