Showing posts with label new job. Show all posts

Friday, 18 November 2011

November writing challenge update

Back at the end of October I put my hand up to participate in a science writing challenge for the month of November by finishing up two papers that really should have been written long since. On 1 November I started my new job, and didn’t write at all that first week as I focused on the 1001 tasks necessary to starting a new job, including moving into my office, rearranging the office furniture to suit my working needs, meeting my new colleagues, obtaining employee cards, library cards, etc.

Early in week two my office computer arrived, and another two potential writing days were lost installing programs and generally making the computer ready to use. However, on Thursday and Friday of that week I actually sat down and finished up the current draft of the paper based on my PhD research. The previous version I had done (while back in Australia in July) was good in terms of presenting the basic facts of what was done and what the results were, but I had been kind of sketchy in the discussion and conclusions section. (I think that is a common failing on my part that I should work on—I am totally comfortable reporting facts, and I am totally comfortable with editing a previously existing discussion/conclusion section, but actually confessing what *I* think is relevant or important about those facts? That is getting kind of personal.)

Be that as it may, since it was necessary to finish the paper I somehow found the necessary motivation/inspiration to just write it—I went back to my PhD thesis, looked at the points covered in that section there, and chose which ones to address here. Not only did I write it all down, in many cases the version in this paper is much clearer and more eloquent than what I had typed when finishing up the degree. Spending a couple of years thinking about other areas of geology actually helped give me some new insights on that project.

In this, my third week on my job I have continued to split my time between needful tasks for this project (doing background meeting, arranging a trip to the mining company with whom I will be working, obtaining a card to let me use the uni gym (free to employees during business hours), etc.) and finishing up previous papers. Since I had sent a copy of the PhD paper to my erstwhile advisor in Tasmania on Friday that meant I could focus on working on the paper from the experimental post doc position I finished last December.

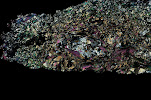
This week I have managed to do some editing of the text and make major progress on a set of figures that should have been done long since: BSE images of every experiment, annotated to label the mineral phases present.

Why hadn’t I created such images previously? Because I documented each microprobe session in CorelDraw. My standard operating procedure was to look at the sample, determine a region to work on, take a picture, transfer it to my personal computer, open it in CorelDraw, and create a new layer for the day’s session in which I would make colour-coded circles superimposed over the picture at the locations for each analysis point. I would give each circle a name that matched the name recorded in the microprobe (such as RC1-NMg1 for the first garnet analysis on sample #RC1-NM). Repeat for each analysis, taking additional photos as needed.

This works very well for recording things, and one can easily go back and compare the results with the appearance of the phase analysed. However, the layers can get confusing for those samples with multiple microprobe sessions (due to the difficulties in getting good results for some phases).

The new, improved, pdf images I am creating for each sample make things much easier—they are all labelled with the pressure and temperature of the experiment, which bulk composition was used, and which phases are present. The phases are colour coded to indicate the quality of the data—if they are in bold print I had five or more good analyses of that phase for that sample which agree. If they are in normal print there were three to five good analyses, if they are in red there were two (or fewer) good analyses, and if the red text has a question mark next to it I know that the phase is present, but it was too small to get a clean analysis so I do not actually know the composition of the phase. Having this information right there with the photo of the sample is very helpful. It is also pretty easy to see why the red text is in red in most cases—those phases really are smaller or too amorphous to get good readings—one can see that in the photo, too.

There is still a week and a half left in November—I think I may be able to finish compiling these images today, so there is a chance that I will be able to complete all of the other tasks necessary for this project before the month ends. However, even if I do not complete this goal, I still thank Anne for having inspired me to set it—I am certain that I would have found plenty of tasks to keep me busy instead of writing these older papers if I had not stated publically that I would do it.

Wednesday, 5 October 2011

The next adventure has been revealed

As of 1 November I shall be employed again. True to my pattern thus far it will be for something I have never done before. My Master's research was a structural geology project focusing on the deformation style and timing of a specific fault in the Brooks Range, Alaska. My PhD research focused on the metamorphic history of all of Tasmania, my first post-doc position introduced me to experimental petrology as a tool for understanding subduction zone processes. Now I am about to start a research position focusing on 3D (and 4D) geochemical modelling of VHMS ore deposit systems in northern Sweden.

This will be a project with a steep learning curve for me since the last two projects focused on metapelitic rocks and now I will need to learn the intimate details of volcanic rocks and what happens when they not only contain ore deposits but also have been subjected to greenschist facies metamorphism.

Needless to say, I left the meeting where I accepted the job offer with a bit of light reading in hand—one textbook: Introduction to Ore-Forming Processes and one PhD thesis: Volcanic Stratigraphy and Hydrothermal Alteration of the Petiknäs South Zn-Pb-Cu-Au-Ag Volcanic-hosted Massive Sulfide Deposit, Sweden. This thesis contains cross sections of one of the important deposits in this area—my project will be to take this sort of research to the next step—modelling the actual volumes involved in 3D.

I will look forward to reading these during the next couple of weeks before the job actually starts—in theory I will be in a much better place to hit the ground running by doing so. If any of you have suggestions for things in the literature that I really should read if I hope to do well with this research feel free to share them here. It is time to start reading 1000 words a day from the geologic literature again. I stopped at the end of last year when my job ended and haven't picked it back up during my extended vacation between jobs. I have enjoyed the holiday, but it is time to refocus on science and learning.

Wednesday, 15 July 2009

Some differences between analyzing minerals in natural rocks and minerals grown in experiments

For my PhD research I worked with Tasmanian metamorphic rocks. The schists I studied had major minerals in the 2 mm to 2 cm size range (though, of course, most of them were closer to 2 mm than 2 cm in size). As a result of these large sizes the approach to microprobe time for mineral analysis was to find sets of minerals near one another (in textural equilibrium) and select points for analysis. I’d take photographs of the selected minerals, make marks upon the printouts showing the locations of the selected points, and then leave the microprobe to do all of the analyses after I’d gone home for the day. Then I’d use ArcMap to align the photographs with the x-y coordinates from the microprobe so that I’d have a good record of where each analysis point was located.

Now that I’ve started my first post-doctoral position things will be somewhat different; I’ve signed on for an experimental position. This means that instead of analyzing mineral assemblages in natural rocks and doing calculations to try to determine at what temperature and pressure they must have formed, I shall be growing minerals at specific temperatures and pressures and analyzing them to see what their compositions are at those temperatures. (The results of these experiments will, in theory, be used by others who wish to determine the temperatures and pressures at which their minerals in natural rocks formed.)

I have not yet gotten to the point of being able to do my own experiments, but today I have spent some time in the microprobe lab with one of my colleagues as she analyzed the minerals which she grew in one of her experiments. The capsule in which she grew the minerals is only a few millimeters long, and the minerals present are all very small. The microprobe here is set up to use a 1 micron beam size, so the minerals need to be at least 1 mm in diameter in order to obtain analyses which are from a single mineral (the one I used in Australia was set up to analyze minerals that are at least 10 microns in diameter—remember that there are 1000 microns in every millimeter!).

Because the minerals here are so small they don’t tend to use the microprobe in automatic mode—instead one stays with the machine while it does the analyses. The procedure is to find a mineral you wish to analyze, analyze it, look at the results, and if it is “good” (has an appropriate proportions of elements for that mineral) move on to a new location to begin the next analysis. If it is “bad” (contains other elements than should be in that mineral and/or contains the correct elements in an unexpected proportion) it is mostly likely due to contamination from a neighboring mineral—sometimes the grain isn’t large enough and the electron beam also analyses the grain next to it, sometimes the grain isn’t thick enough, and the analysis includes the underlying grain. In this case you also move on to the next analysis, but you keep track of the number of “good” vs “bad” data, so that you can obtain sufficient “good” results to be able to state with confidence the composition of each of the minerals in the sample.

The approach is very different to what I have been used to, and requires one to become accustomed to looking at the raw microprobe data (hitherto I simply took the report generated by my microprobe operator and ran the results through the program Ax to convert it to number of cations per oxygen, and then dealt with the numbers only in that form. I am very much looking forward to starting my own experiments—I think that the procedures used here will help me to better understand the microprobe and how it operates, and it all sounds like fun. But first, there is much background reading to do…

Wednesday, 8 July 2009

Here's one I prepared before

Is it cheating to participate in this month's Accretionary Wedge by simply linking one's first ever blog? How nice of them to request a topic upon which I've already written, since I've not had much time for writing recently.

I've been taking time off from geology related stuff--I've had just over two weeks of adventures visiting friends and family in the US after finishing up my PhD project in Tasmania and before heading to Europe for my first post-doc position (the degree itself will be complete sometime in the next few months, after the examiners have had a chance to look over my results and I've had a chance to do any corrections they wish to see). I fly to my new home in another four hours, with luck I'll be posting again regularly soon.