Monday 28 June 2010

potential calamity averted by a careful change in the erosional surface orientation

My most recent experiment is one I’ve long been looking forward to analyzing—this is the highest-pressure run I’ve done yet. We gave it nearly 500 hours in the piston cylinder, while I was busy with lots of travel and a minor bout of food poisoning. Once we finally downloaded it and I rescued the capsules from their nest I discovered that they were stuck together. We always run two capsules (2 mm diameter gold tubes, welded shut around the experimental charge) in every experiment, with different compositions in each.

Usually it is enough to set them in the palm of my hand and rub them back and forth a bit to cause them to break apart before I carefully break off the last of the MgO, salt and graphite that clings to the capsules. This time they stayed stuck together no matter what I tried, so I consulted with my boss, who suggested that I try carefully grasping each with jeweler’s pliers and seeing if I can break them apart that way. Alas, they did not separate, instead one of the two capsules started to tear open.

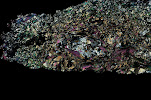
Therefore I stopped trying and instead we put both capsules into a single epoxy mount. Knowing that it would require a fair bit of luck for the capsules to be oriented within the mount such that it would be possible to expose the insides of both capsules when I went to polish them I put off the task and spent the weekend visiting with friends. This morning I finally decided to look at the mount and try my hand a polishing them. When I looked I determined that the important ends of each capsule were not on the same plane with respect to the surface of the mount, but it looked like if I were careful to put more pressure on the one side than the other it might be possible to change the dip of the top of the mount such that both capsules were intersected. Much to my delight I managed to accomplish exactly this task. I now have one mount with two capsules, both exposed, all polished and turned in to be carbon-coated in preparation for tomorrow’s microprobe session.

This makes me very happy. I did not like the alternative, which would have been polish enough to expose one of the two, analyze and photograph everything in it and then polish it away to expose the other one for analysis. This way we will be able to go back and re-analyze anything we want at any time, rather than having one of them cease to exist in order to reach the other.

Wednesday 16 June 2010

play with the data long enough and it becomes possible to find a way to see patterns in it

One of the things I’ve been struggling with in my current research is how best to communicate the results from the various experiments I’ve run. My experiments have thus far yielded a total of ten different phases, with as many as seven of them appearing in a single experiment. I use two different capsules at each pressure and temperature at which I run experiments; each capsule has a different bulk composition. Therefore I’ve been displaying the result graphically, by using 8-pointed stars divided into an inner ring for one of the composition types, and an outer ring for the other. The resultant triangles representing the phases present are either left blank if it isn’t present or filled in with colour-coding if it is. One phase, quartz, is always present (save for when we reduce the starting SiO2 to eliminate it), so it doesn’t need a triangle of its own, and another occurs only in one high-P run, so it appears as a different colour triangle replacing one attached to a low-P phase; this is why I’ve been able to get away with using only eight points for the star.

However, there are times when it is necessary to communicate with text or a table, rather than with an illustration, and this is where I’d been stymied. I simply wasn’t seeing much in the way of a pattern with my data in terms of mineral assemblages. A mineral assemblage is the group of minerals which are all stable at the same pressure/temperature; they would have been the products of the reaction(s) which produced the assemblage. (When doing experiments we talk of phases rather than minerals—a phase is a particular composition of a mineral (many minerals can have more than one possible compositions, so may be considered a family of mineral phases)—in general only one phase within a family will be stable at a given set of conditions) .

Today I finally discovered a way to organize my data so as to see patterns in the assemblages. This required using colour coding and playing with the data, combining them into groups until I was able to determine that the “important” phases of the list of 10 are talc, garnet, and biotite. The others are either ubiquitous (quartz, chloritoid and muscovite) or only show up in a few of the runs and can be considered "minor" (zoisite, lawsonite, kyanite, carbonate). Once I’d worked that out, I was able to split the data into four groups each of which are +/- the minor phases and + the ubiquitous phases.

However, it was also necessary to consider each of the two bulk compositions separately to see the relationships between the groups, and I had to draw circles around the stars on my original P-T diagram to see how the groups relate to pressure and temperature. (I love having a drawing program which lets one draw circles on layers that can be made visible or invisible, so that one can see only the circles relevant to a single composition at one time.) Once I had all of the groups for each bulk composition circled it was easy to see that:

The experiments using the metagreywacke composition only have groups A, B, and C thus far. These groups plot on diagonal trends for this composition such that with respect to temperature B is less than both A and C, but with respect to pressure C is less than both B and A.

The experiments with metapelitic composition have groups A to D which plot in a grid such that with respect to temperature B is less than A while D is less than C and with respect to pressure C is less than A while D is less than B.

Now that I can see these patterns I shall really look forward to obtaining the results from future experiments to see how they relate to this overall pattern.

Saturday 5 June 2010

Anorthosite and asphalt

I spent two days this week on a field trip in western Norway, where our guide assures us that the world’s best (ultra) high pressure rocks are located. It is my plan to do a proper field trip post, including photos, but in the mean time I’ll share with you a snippet of information I learned about one of the rock types we drove past, but did not stop at.

Near the town of Florø, Norway, there are a variety of white road cuts which are made of anorthosite. The primary (only?) mineral in anorthosite is plagioclase feldspar. In this area anorthosite is often quarried and used for making asphalt. Why? Several reasons:

* White colour of anorthosite makes whiter asphalt = better visibility for driving at night or under cloudy conditions.

* Plagioclase hardness (~6 on Mohs scale) makes for more durable, and therefore longer lasting asphalt.

* The plagioclase cleavage planes means that as cars drive on it and break it down the crystals maintain their edges, which provides better traction, even when wet.

Alas, I didn’t manage to get a photo of any of the anorthosite outcrops we passed—my camera has too long of a delay between pushing the button and taking a photo, which means that by the time I saw the outcrop it was too late to photograph it at the speeds our bus was traveling. But I was able to find a photo on line of an outcrop down near Bergen, which appears on this web page.