Friday 30 December 2011

"Directly" experiencing Subduction-Zone processes

I haven’t made time to participate in an Accretionary Wedge for a long time, so when Ron Schott called for the "Most Memorable/Significant Geologic Event That You’ve Directly Experienced", I thought it was about time to come out and play this game again.

In his call he gives some examples of a few processes that take place in human observable time frames and at surface pressures and temperatures (e.g. earthquake, landslide, flood…) and he repeats the part of his challenge about our being able to directly observe and experience the process we write about.

However, the sorts of geologic processes which most fascinate me are not those which create sediment at the surface of the earth, nor yet processes which produce fine-grained igneous rocks. To my eyes the most significant geologic processes are those which are responsible for creating the pretty rocks that drew me into geology in the first place—the ones with beautiful large crystals. Metamorphic processes, and also igneous processes when they take place deeply enough to permit significant crystal growth, are my favourite of all of the many geologic processes. However, the pressures and temperatures which are responsible for making particularly pretty rocks are well in excess of what our frail bodies can tolerate, which means that the process isn’t something I can ever "directly experience".


Or is it? How can we ever know what is happening within a subduction zone?


This question was not only of interest to me, but also to the international research team I joined when I began my last post-doc position. While none of us could go down the subduction zone ourselves to find out what was happening there, we were able to bring a tiny bit of the subduction zone setting into our lab.

Using a piston cylinder apparatus I regularly performed experiments which match the sorts of pressures and temperatures one would find if one could enter a subduction zone. While real rocks can spend millions of years working their way down a subduction zone and then back up again, I only held my samples at high pressure and temperature for two to four weeks at a time. As a result the crystals I grew from my powdered starting material did not achieve the large, stunningly pretty, sizes one can find in metamorphic rocks, but they did grow up to 100 µm in length (remember that there are 1000 microns in every millimetre), and many were lovely to look upon in the BSE images.

Having had the opportunity to perform such experiments I confirmed for myself that yes, pressure and temperature do matter to the minerals in a rock. If one takes the exact same starting material and "cooks" it at different settings one will get a different assemblage of minerals for each combination tried.

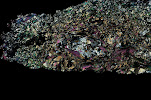
The below images show some of the results for one of the compositions I tested, at three different pressures (2.65, 2.8, and 3.0 GPa), and three different temperatures (600, 625, and 650° C). As you can see, the sets of phases present are very different for each experiment. Even the phases which are present in all experiments are present in different abundances when the pressure, temperature, or both are changed.

The few photos I have shared with you today are just a glimpse some of the experiments I have done. All of them together have transported my imagination to the depths of a subduction zone, and brought the merest hint of a subduction into my lab. This is "directly experienced"enough for me.


List of abbreviations:

grt = garnet

mu = muscovite (or other white mica)

qtz = quartz or coesite*

ctd = chloritoid

anth = anthophyllite

tlc = talc

*In all cases the SiO2 phase is labelled "qtz", even when it is at pressure high enough for that phase to probably be coesite—the microprobe does not differ between those two phases, and I did not check it with another technique (such as Raman) because the difference between quartz and coesite wasn’t relevant to my work, which was focused on questions related to the stability fields of talc, biotite, and garnet.

Thursday 29 December 2011

Wish I had seen this one years ago

Earlier this month I discovered that it is possible for me to download entire textbooks from the internet. Now, it may be that the reason I can do this is because I am on a university computer and they have an account with the publisher which makes it possible, but since a high percentage of readers who might be interested in the book I am about to talk to you about are likely to associated with a university in some capacity, there is a reasonable chance that you will have access to it as well, if not as a download, perhaps in paper at your uni library.

The book which I am enjoying reading just now is Phase Equilibria in Metamorphic Rocks, Thermodynamic Background and Petrological Applications, written by Thomas M. Will, published in 1998 by Springer, DOI: 10.1007/BFb0117723. This is volume #71 of a Lecture Notes in Earth Sciences series.

When I first started my PhD project in the field of metamorphic petrology I was coming into the field cold—it had been years since my last geology course of any sort, and I had had no background courses on topics like thermodynamics or the many calculations associated with phase equilibria. Consequently, when I started reading papers which included formulas that explained how the authors had arrived at their estimates for the pressure and temperatures at which their minerals formed I found myself skipping over the equations and looking for the sentences that explained what was done. Over time and after reading many papers which did this sort of thing I started to gain a partial understanding of the topic. Enough to apply the tools to my own samples and arrive at numbers that, hopefully, actually reflect the history of the samples.

However, while I could follow a recipe for calculating pressure and temperature of formation for metamorphic minerals, I choose which recipe to apply based on the fact that my samples were similar to those in the published papers, not because I had any real understanding of the models which underpinned the calculations. Terms like “ideal” vs “non-ideal” mixing painted pictures in my mind because I know what those words mean grammatically, not because I actually knew the difference between them as applied to the crystal structure of a mineral.

If you are in a similar boat, and would like to actually see good definitions of those terms, along with others like “entropy of mixing”, “activity-composition (or a - x)”, this may be the book for you. So far I have only managed to read the first 40 pages, but already I have a *much* better understanding of why it is that one gets such hugely different results in terms of pressure/temperature estimates depending on which model one uses for a given mineral, and a much better understanding why programs like Perple_X have so many models available to choose from. The author is kind enough to work through example calculations in a step-by-step basis, so that the reader can learn how it is done. Sure, when actually doing the geology you aren't going to do these calculations by hand—at the very least you will have a template full of formulas set up in a spread sheet, if not using a more complicated program to do the work for you, but it is always nice to understand *how* the program does the calculations—this makes it much easier to spot if a typo in the data-entry stage resulted in a geologically implausible answer being spit out by the program.

Thursday 15 December 2011

Science is the ultimate game for adults

I have just come from listening to a lecture by Dan Shechtman, this year’s Nobel Laureate in chemistry. The topic of his speech was his 1982 discovery of quasi crystals which has led, all these years later, to his achieving a Nobel Prize for his work.

He began his talk with an introduction to the science of Crystallography, which was founded in 1912 when Sir William Lawrence Bragg and his father Sir William Henry Bragg first starting using X-rays to study the diffraction pattern caused by crystals. (Prior to that breakthrough people studying crystals measured the angles between the faces of crystals, which had been done at least as far back as the 1600’s—Johannes Kepler published studies of snowflake crystals in 1611, and in 1669 Nicolaus Steno reported consistent sets of characteristic angles for quartz crystals, no matter where the crystals came from.)

During the next 70 years crystallographers studied 1000’s of crystals using X-ray diffraction, and they all conformed to a set of rules which became accepted as the definition of a crystal:

*They all had a periodicity; if you measure from the center of the diffraction pattern to the first spot, and then move out again that distance in the same direction you will encounter another spot, and another again each time you repeat the pattern.

*they all had a rotation of symmetry; this means that if you rotate a crystal around an axis you will get a repeat of the same pattern every certain number of degrees. The possible amounts of rotation were 2, 3, 4, and 6.

This means that a crystal with a 2-fold rotational symmetry can be rotated half way around (180 degrees) and will look exactly the same as before it was rotated. A crystal with a 3-fold rotational symmetry can be rotated to three different positions (each 120 degrees apart) which have the exact same pattern. 4-fold means that each rotation is 90 degrees apart, and 6 fold is 60 degrees apart.

As Professor Shechtman emphasized in the early portion of his talk, this list was it—crystallographers knew that no other rotation symmetry pattern was possible. There was no such thing as a 5-fold rotational symmetry, nor were there any crystals with rotational symmetry greater than 6. This was so well accepted that when he was a student he once had an exam question requiring that he prove that 5-fold rotational symmetry was impossible.

He shared with us his answer on the projector screen. It works better with images, but I will try it with words alone (see this page for more details). Start with a dot on the center of your page, then put five dots around it in a ring, each 66 degrees apart, all the same distance from the center dot and from one another. If 5-fold rotational symmetry is possible one could then take any pair of those encircling dots, rotate around them in five steps, plotting a new circle of dots around each, and the new dots around one would line up with the new dots around the other. However, as he showed us on the screen, this does not happen—if you colour one set in blue and the other in red they clearly fall near, but not upon, one another.

Therefore when he noticed a crystal which showed a 10-fold axis of rotation on a transmission electron microscope on the afternoon of 8 April 1982 is was more than a bit surprised, as one can see with the triple question marks he wrote in his notebook. His first thought was that it must be the result of crystal twinning, which had been known to cause the appearance of five-fold rotational symmetry but was really the result of having more than one crystal contributing to the diffraction pattern. So he zoomed in to the limits of the machine and took the diffraction pattern again, several more times, and each time he received the same result—a 10-fold rotational pattern, and from areas so tiny that the possibility of there being more than one crystal contributing to the pattern had been eliminated.

How was this possible? Well, the substance he was studying does have a rotational symmetry that had previously thought to be impossible, but it achieves it by lacking in periodicity—the pattern does not repeat if you jump a set distance in a given direction. As a result of his discovery the definition of a crystal has changed to say “any solid having an essentially discrete diffraction diagram”. These days we call substances such as the one he discovered “quasicrystals” and it turns out that they are reasonably common. But in the early days after the publication of his discovery he met with much resistance to his ideas—one scientist was even heard to declare that there are no quasi-crystals, only quasi-scientists”. However, as happens with science, other laboratories repeated is results, both with the compound he first noticed the phenomena in, and then with other compounds, and gradually the acceptance spread throughout the scientific community.

After he finished his speech there was time for a few questions from the audience. One of the University faculty members ask him a question—she pointed out that this university, like many others, has difficulties attracting students to the study of science, and she wondered if he had any advice in how we might better convince young people to study science. His reply included one of the best quotes I have heard in ages “Science is the ultimate game for adults”.

I believe that he is, in fact, correct with that description—studying science is fun, it requires us to use both our logical and creative parts of our brains, and to push both to their limits. It provides enough challenge to prevent us from ever being bored, and it comes with possibility of making discoveries which change the way we view our world. What could be more fun than that?

Monday 5 December 2011

Can’t make it to AGU this year? Neither can I, but I will still visit the poster session

It is once again the time of the year for the big AGU conference in the US. I made it to the one two years ago, and found it kind of overwhelming in its hugeness, with talks and posters on any number of topics which fall into categories of which I know nothing, because geology is nothing if not a huge broad catch-all of a science. Fortunately for us that meeting, like many others these days, has a fully searchable program, permitting us to find those talks or posters we should hear/see because they relate to our own research, and those talks which are totally outside our current research but still fall into topics which are of personal interest. This year, in addition to having the computerized program, they have also made much of the poster session available on line. Therefore those of us who are staying home can still have the fun of wandering the crowed isles and looking at interesting research results. So ahead, go on over, look at some posters, and learn something new. Perhaps you will even find something interesting enough to send the author a note inviting conversation on the topic.

Friday 2 December 2011

reading for fun and education

Sixty days ago I received the job offer to start my new job, and was given a small pile of literature for background reading before I started. As a result I started my “1000 words a day” challenge once again, after having had nearly a year off since last I had done that. The challenge is simple: do a little reading in the geologic literature every day, and keep track of how many days in a row you manage before you miss one. If you miss one re-start and begin the count from zero once again. How much is 1000 words? Well, today’s post is 691 words long. It doesn’t take much time to read that many words, but I have found that if I read that many I often keep reading the article until I either reach a natural breaking point or finish the article. Some days I read quite a bit more, others I just barely make the goal (do I actually count the words? No, not any more. And when I did at the beginning of the first time I undertook the challenge I didn’t count all the words, just how many words were in the first line of a paragraph, and how many lines long it was to calculate a rough word count for the paragraph, and then figured out how many paragraphs of that size it would take to reach at least 1000 words. It isn’t the precision that matters, but the consistency of actually reading (and thinking about what you read!) every day.

Since I started this time I have remembered to read every day. This has been easy during the week days since my job begun—the pile of literature I need to read and understand in order to get my knowledge base to where it needs to be for my research project is quite substantial, and growing all of the time as I find references to more and more articles I wish to read. Managing it on the weekends is a bit more of a challenge, but I have managed, so far.

So, what have I read over the past 60 days? I have completed reading six articles that relate directly to the ore deposits in the area near where my project is based (ok, one of those wasn’t a single article, but rather a PhD thesis which was comprised of five different papers, so really I have done 10 articles total on this subject), four articles on the concept of 3D modelling, and one article on geochemistry.

That last one (MacLean 1990)* explains how one can use ratios of immobile elements to calculate what the unaltered composition of a suit of altered rocks must have been. I am gathering from my reading (many of those local papers cite this technique paper) that this is a very useful way to determine what types of rocks were present before the hydrothermal alteration associated with the formation of ore deposits. It works especially well when the precursor rocks are volcanic and changed in composition due to fractionation of the magma. When this is the case one can plot the current compositions on the same diagram as the curve which shows the expected changes in composition due to fractionation, and extrapolate from the trends in the current compositions back to the likely original compositions when the rocks cooled from their magma. The paper mentions that these sorts of calculations are easy to set up in a template in a spreadsheet, and that they will give away such templates upon request. I wonder if that offer is still open two decades after the paper was published, or if people use a different technique to accomplish the same sort of task today. I will have to do a search for papers which cite this one to work my way forward to the modern techniques, if they have changed. What did people do for research before it was possible to easily look up who had cited a particular paper?

*MacLean, W. H. (1990). "Mass change calculations in altered rock series." Mineralium Deposita 25(1): 44-49.

Wednesday 30 November 2011

How I am spending my time

I have mentioned previously that I keep a log of how I spend my time. When I was doing my PhD the interesting question was what percentage of my time was spent on “uni work”, and how was I spending the rest of my time? That way I could look at the graphs and easily decide what I should change if I wasn’t happy with my progress. I have maintained those logs since finishing that degree, and even made use of the data when applying for my visa to move to Sweden—the abrupt increase in the amount of time spent doing “social” activities when I met my partner was part of the documentation that we really do have a relationship with one another.

However, comparing “uni work” to all of the other aspects of my life is not the full story. This morning I was struck with the inspiration that I should also track what sorts of “uni work” I am doing. Since it has only been one month since I started my new job it seemed like a good time to set up the spreadsheet to calculate that, too. I have created five broad categories into which all of my “uni work” tasks fit. I then compared the data in my descriptive log of what tasks I accomplish each day (e.g. “revised figure 2.5 to show____”, or “received a copy of my hire paperwork from HR and filed in in folder ____”) with my numeric log showing how many hours in each day were spent on uni work, and have estimated the split for each day since this job began. In addition, I also calculated my time for most of October, since I did my job interview, began reading the literature my boss gave me as background reading for this project then, and attended two different short courses during that month.

Setting up the spread sheet and doing those estimates took all morning, but since that was 58 days’ worth of data that means that I spent less than 4 minutes a day on this project. Now that the spreadsheet is set up it should be even easier to keep it up to date by entering in the new data, and I think that I can easily spare 4 minutes a day for the return of seeing the distribution of how I am spending my time. This will be particularly useful as my boss told me that the teaching component of my work should only be 10 to 20% of my time, and this way I will know if I am falling under, meeting or exceeding this target.

The categories I chose are:

* Research: which has three sub categories, the first of which is my current job (3D geochemical modelling of ore deposits in northern Scandinavia), the second and third are finishing up the papers based on my PhD and last post-doc positions.

* Learn: reading literature, attending courses, attending conferences, talks, and seminars, studying Swedish, etc.

* Teach: teaching classes, teaching prep, meetings about teaching, etc.

* Admin: administrative tasks, filing, computer maintenance issues (install programs and hardware, backup, etc.), paperwork, work-related travel, funding applications, updating logs, cleaning/organizing the office, meetings on any of these sorts of topics, etc.

* Netwk: networking, updating resume, updating LinkedIn and Academia.edu, interviews, public outreach, job applications (when this contract draws to a close), etc.

For the month of October I worked a total of 82.6 hours (which all counts as bonus time, as my job had not yet started). Of that time 68% was spent on “learn”-related tasks, 31% was “admin”, and 1% was “netwk”. There is still nearly half a work day left for November, but the month is close enough to done to report that my time this month has been split roughly:

38.9% research (10.5% this job, 20.5% last job, and 7.9% PhD research)

31.5% admin

12.5% learn

17.1% netwrk

0% teach

Assuming 8 hour work days, no work on Sat or Sunday, and only 4 hours for the one Friday in November which was a half-day holiday I should have worked 172 hours on this job so far this year. However, because I started work-related tasks back in October I am already up to 233.4 hours, or 135.7% of the hours I need.

Combining the data for October and November gives:

32.1% learn

31.4% admin

25.1% research (6.8% this job, 13.2% last job, and 5.1% PhD research)

11.3% netwrk

0% teach

It will be interesting to watch how the balance between the categories shifts each month.

Thursday 24 November 2011

Well, that changes everything. Perhaps.

I have heard it said that sometimes the most exciting moments in science are when you look at something and say “that’s odd!”. I had one of those moments today. I have been working on the paper from my post-doc research this week, and the main focus of my work has been the figures. I now have very good, clearly labelled BSE images of every sample analysed and am starting to reference them in the text of the paper. The process consists of saying things like “Garnet ranges in texture from thick rims overgrowing seeds to a spray of very small grains” and then adding parenthetical notes behind each type pointing to figures that show each sort. In the process I also listed those samples which have no garnet at all, with reference to their photos.

This is where the “that’s odd” moment came in. For one of the samples my table of results shows that it has garnet, and that I have five good analyses of it. However, the photo of that sample shows that there is no garnet at all, unless you count the seeds of a vastly different garnet composition that were included in each experiment to give the new garnet an easy place to start growing. Clearly something is wrong here, so I checked the data file and determined that the five garnet analyses we have for this sample were done by my predecessor in this project years before I arrived. In my own records I also have three analyses of garnet seeds from this sample. Comparing his data with my own shows that the garnet analyses he did are clearly *not* the seeds—for this sample the seeds are grossular garnet (the calcium end member) but the garnet he analysed are iron-rich with only a little Mg and Ca. Sorting all of the garnet data for all of the samples shows that his analyses for this particular sample fall nicely in the middle of the pack in terms of composition.

So what is going on? I can think of a couple of logical possibilities off the top of my head. One (kind of obvious one) is that I somehow analysed the wrong sample myself and the photo I have is not the sample I think it is. Another is that I did analyse the correct sample but there is something wrong with his data. A part of me hopes that it is the latter—not just because of vanity and the hopes that I did everything perfectly, but more because it would clear up a problem that has been bothering me with my results since I first obtained the data.

I ran my experiments at three different temperatures: 600, 625, and 650 C. For the two higher temps garnet was present for every pressure I tried. For 600 C, on the other hand, I found no garnet at all in any of the metapelite runs, but it was present in 3 of the 4 metagreywacke runs. Now, had those three been adjacent to one another I wouldn’t have complained. But they weren’t. Instead I had garnet present at 2.2 GPa, garnet absent at 2.5 GPa, and present again at 2.65 and 2.8 GPa. This makes it difficult to draw pretty diagrams. How much nicer they look when a phase is absent for one half and present for the other half of the diagram.

So now I sit and eagerly await a reply from my erstwhile boss to the email I just sent him. Depending on how he replies I will have work to do changing the write up to match the new situation—do I get to delete the analyses of garnet for this sample that he did, and write the paper with a story that makes sense to me, or will I need to beg him to find the real sample and put it into the microprobe and take new BSE images and do an analysis or three to confirm that the composition my predecessor saw all those years ago are correct, or…?

Friday 18 November 2011

November writing challenge update

Back at the end of October I put my hand up to participate in a science writing challenge for the month of November by finishing up two papers that really should have been written long since. On 1 November I started my new job, and didn’t write at all that first week as I focused on the 1001 tasks necessary to starting a new job, including moving into my office, rearranging the office furniture to suit my working needs, meeting my new colleagues, obtaining employee cards, library cards, etc.

Early in week two my office computer arrived, and another two potential writing days were lost installing programs and generally making the computer ready to use. However, on Thursday and Friday of that week I actually sat down and finished up the current draft of the paper based on my PhD research. The previous version I had done (while back in Australia in July) was good in terms of presenting the basic facts of what was done and what the results were, but I had been kind of sketchy in the discussion and conclusions section. (I think that is a common failing on my part that I should work on—I am totally comfortable reporting facts, and I am totally comfortable with editing a previously existing discussion/conclusion section, but actually confessing what *I* think is relevant or important about those facts? That is getting kind of personal.)

Be that as it may, since it was necessary to finish the paper I somehow found the necessary motivation/inspiration to just write it—I went back to my PhD thesis, looked at the points covered in that section there, and chose which ones to address here. Not only did I write it all down, in many cases the version in this paper is much clearer and more eloquent than what I had typed when finishing up the degree. Spending a couple of years thinking about other areas of geology actually helped give me some new insights on that project.

In this, my third week on my job I have continued to split my time between needful tasks for this project (doing background meeting, arranging a trip to the mining company with whom I will be working, obtaining a card to let me use the uni gym (free to employees during business hours), etc.) and finishing up previous papers. Since I had sent a copy of the PhD paper to my erstwhile advisor in Tasmania on Friday that meant I could focus on working on the paper from the experimental post doc position I finished last December.

This week I have managed to do some editing of the text and make major progress on a set of figures that should have been done long since: BSE images of every experiment, annotated to label the mineral phases present.

Why hadn’t I created such images previously? Because I documented each microprobe session in CorelDraw. My standard operating procedure was to look at the sample, determine a region to work on, take a picture, transfer it to my personal computer, open it in CorelDraw, and create a new layer for the day’s session in which I would make colour-coded circles superimposed over the picture at the locations for each analysis point. I would give each circle a name that matched the name recorded in the microprobe (such as RC1-NMg1 for the first garnet analysis on sample #RC1-NM). Repeat for each analysis, taking additional photos as needed.

This works very well for recording things, and one can easily go back and compare the results with the appearance of the phase analysed. However, the layers can get confusing for those samples with multiple microprobe sessions (due to the difficulties in getting good results for some phases).

The new, improved, pdf images I am creating for each sample make things much easier—they are all labelled with the pressure and temperature of the experiment, which bulk composition was used, and which phases are present. The phases are colour coded to indicate the quality of the data—if they are in bold print I had five or more good analyses of that phase for that sample which agree. If they are in normal print there were three to five good analyses, if they are in red there were two (or fewer) good analyses, and if the red text has a question mark next to it I know that the phase is present, but it was too small to get a clean analysis so I do not actually know the composition of the phase. Having this information right there with the photo of the sample is very helpful. It is also pretty easy to see why the red text is in red in most cases—those phases really are smaller or too amorphous to get good readings—one can see that in the photo, too.

There is still a week and a half left in November—I think I may be able to finish compiling these images today, so there is a chance that I will be able to complete all of the other tasks necessary for this project before the month ends. However, even if I do not complete this goal, I still thank Anne for having inspired me to set it—I am certain that I would have found plenty of tasks to keep me busy instead of writing these older papers if I had not stated publically that I would do it.

Thursday 3 November 2011

Intriguing distractions

One of the things I have been reading in the process of learning the things I need to know for my new job is the book "Description of regional geological and geophysical maps of the Skellefte District and surrounding areas" A comment in the introduction caught my eye "Application of geophysical methods in metal exploration started more than three centuries ago in Sweden. Magnetic methods were in use as early as 1640.".

Sadly, the paragraph did not list a source for this information. However I see that one of the editors of the book is my boss, so I have emailed him to ask if he happens to know of the source. I did see a couple of books from the 1800's cited in the bibliography, so perhaps one of them could be the source. It looks like our library might have them, but they are in Swedish. While my language learning has gotten good enough to easily read children's books and books that I have read before in English, I fear that I am not up to trying to track down obscure references to magnetic methods which were in use in the 1640's. So instead I will make note of it here—perhaps next year I will be fluent enough to chase up that information, if my boss doesn't have a useful reply (he is traveling now—he has been at a conference all week).

Ok, back to real work, the clock is ticking…

Monday 31 October 2011

Taking up the gauntlet

Anne, over at Highly Allochthonous, has set a challenge for herself, and the rest of us—get those papers we have been meaning to write finished up and ready to submit during November. The timing is perfect. While I have had, in theory, 10 months with nothing to do but write up the results of my research, in reality I enjoyed my time of unemployment by doing non science adventures with my new love. But my life of leisure is at an end, starting with tomorrow, 1 November, I am employed once again.

I know from experience that starting a new job can make it difficult to finish up papers from the last project, but they tell me that it could be 10 days before I get a computer in my office and I won't have the meeting to get the data from the mining companies until some as-yet-to-be-determined date, which is a grand excuse to seriously sit down and catch up on those last few tasks to finish up the two papers that have been in progress for longer than they should have been. Stay tuned for updates on progress towards this goal…

Monday 10 October 2011

texture short course, day one

Back at the beginning of the summer I saw an ad for a workshop on texture analysis to be held in Tromsø in October open to students and researchers. It sounded interesting, so I sent them a note asking if it was open to researchers who are between contracts, and they said that it was, and (more importantly given the "between contracts" part, the only course fee would be to cover the copying expenses. When I got the job offer for the position I will start on 1 Nov. I asked if he thought I should attend the workshop, or if my time would be better spent staying home and reading literature directly relevant to the project. After looking over the flyer for the course he said that he thought I should go.

It turns out that the most efficient way to get to Tromsø from Luleå is to drive—they have no train this far north, so one would have to switch to a bus part way there, and flights go south to Stockholm and then west to Oslo or Trondheim before heading back north again. Therefore I checked with a friend of mine who is a graduate student with a flexible schedule, and he thought a road trip sounded like a good idea (besides, going away for a week might actually get him to do some writing). We had a nice drive up on Sunday—left Luleå just after 08:00, and arrived at our B&B (located 15 minute walk from the Uni) just after 18:00. (I, of course, forgot to take out the camera once during the drive, since I was so busy gazing out the window at the lovely mountains once we got close to the Norwegian border).

The course is divided into two sections—the first two days we are learning how to use the programs they use here to convert a series of rotated photos of thin sections into data showing the orientation of the crystallographic axes. The technique works only on uniaxial minerals, such as quartz or calcite (or ice), but since these often occur in units which have been deformed it is a useful tool.

It was very enjoyable to be back in a classroom again after a longish break, though a bit of a challenge to keep up with the exercise—the program we are using runs only on MacOS, and I haven't really needed to use Apple computers since my class in programing Basic on an AppleIIe back in highschool. Apple products have changed a bit since then, and while there are similarities in the handling between Apple and PC there are just enough differences that I found myself pushing the wrong button more than once and then frantically trying to undo that and get back to where I was meant to be before the teacher had gotten so far ahead that I couldn't catch up. Sometimes I managed it, sometimes I was the voice saying "wait, what folder was that?".

Fortunately, she was very patient when we got lost, and would back up and explain the steps we hadn't caught so that we could go on to the next step. I think we all managed to convert the raw data into the correct formats and align the stacks of images properly. Tomorrow we get to actually process that data into the sorts of final images that wind up in publications…

Wednesday 5 October 2011

The next adventure has been revealed

As of 1 November I shall be employed again. True to my pattern thus far it will be for something I have never done before. My Master's research was a structural geology project focusing on the deformation style and timing of a specific fault in the Brooks Range, Alaska. My PhD research focused on the metamorphic history of all of Tasmania, my first post-doc position introduced me to experimental petrology as a tool for understanding subduction zone processes. Now I am about to start a research position focusing on 3D (and 4D) geochemical modelling of VHMS ore deposit systems in northern Sweden.

This will be a project with a steep learning curve for me since the last two projects focused on metapelitic rocks and now I will need to learn the intimate details of volcanic rocks and what happens when they not only contain ore deposits but also have been subjected to greenschist facies metamorphism.

Needless to say, I left the meeting where I accepted the job offer with a bit of light reading in hand—one textbook: Introduction to Ore-Forming Processes and one PhD thesis: Volcanic Stratigraphy and Hydrothermal Alteration of the Petiknäs South Zn-Pb-Cu-Au-Ag Volcanic-hosted Massive Sulfide Deposit, Sweden. This thesis contains cross sections of one of the important deposits in this area—my project will be to take this sort of research to the next step—modelling the actual volumes involved in 3D.

I will look forward to reading these during the next couple of weeks before the job actually starts—in theory I will be in a much better place to hit the ground running by doing so. If any of you have suggestions for things in the literature that I really should read if I hope to do well with this research feel free to share them here. It is time to start reading 1000 words a day from the geologic literature again. I stopped at the end of last year when my job ended and haven't picked it back up during my extended vacation between jobs. I have enjoyed the holiday, but it is time to refocus on science and learning.

Tuesday 27 September 2011

and the draft comes back

Any readers who have been paying attention for a while know that I have yet to actually publish the results from my PhD research. My first attempt at a paper draft, written during the first month or two after starting my first post-doc position got a "this reads too much like a thesis, you are putting in too much information" reply from my advisor. Somewhat discouraged I set that project aside and didn't make much more progress on it during the 1.5 years of that post-doc position—only really managing to take it out once in a while, dust it off, work on it for an hour or three, and set it back aside.

However, when I was back in Australia this July (applying for my visa to settle in Scandinavia with my partner), I met with my advisor. Together we determined what I needed to do with the paper, and I managed to leave him what felt to me like a very good draft before boarding the plane to return to the northlands. Today, at long last, he has returned that draft to me with comments. Not surprisingly, his main point now is that the paper has become too short—while culling stuff from the too long version I got over-enthusiastic. Fortunately, this time he has concrete suggestions as to what should go back in, and why. Therefore I now have a goal: try to get a new, improved, draft back to him before my job interview next week (since, if I get the job I will want to focus my energies on learning the new position, rather than finishing up overdue projects). With luck I will not only accomplish that goal, but it will land on his desk at a time when he is actually able to reply promptly, rather than having a month or more slip by before he can even look at it. Perhaps one day in the not too distant future I can change the status of that paper from "in progress" to "submitted"…

Tuesday 13 September 2011

how to get a PhD when you aren't a goal-oriented person

This afternoon I found myself in a conversation where, once again, I described myself as not terribly goal-oriented. Nearly every time this comes up people express surprise—how can I not be goal oriented and yet have a PhD—isn't that achievement only possible if one is driven to achieve a fairly major goal? The answer is that, no, that is not the only way to get that degree. Certainly many who have one are goal oriented and used that goal as the driving force for all of the work that is required, but not me.

In my case I went to University because I loved learning and had so much fun in high school that I wanted it to continue. For me there was never a question of "what kind of job will this degree get you later?", but only the question of "what cool things do I wish to study now?". The beauty of my approach is that one gets to ask that question over and over again, each time one registers for a new term, and each time the answers will be slightly different. What got me to move on from undergraduate classes to graduate school was the discovery that someone would pay me to be a student. This sounded much better than paying to spend my time learning things, so I completed my Bachelor's degree and enrolled first as a Master's student, and later as a PhD student. Once I enrolled in graduate school I did work towards completing the degree, but not because I was driven by the goal of obtaining the degree, but because when someone else is paying for my education it comes with a certain obligation of actually doing well in my classes (with the Masters) and the research (both Master's and PhD). Besides, both programs came with a limited-time offer on their funding—the rules of the game were clear—your funding runs out after a certain number of years and you have a choice—get the degree by then, or go without. I may not be goal oriented, but I do have a fairly strongly developed sense of responsibility, and if my part of the bargain for the "free" education is to complete the degree, well, yes, I do have what it takes to do it.

Tuesday 30 August 2011

but I thought such things were fiction

Although I have been busy enough with other aspects of my life that I haven't been doing much science of my own (unless you count kitchen baking experiments) I am continuing to read the various emails I get from geology lists. The list for people who are part of the mineralogical society of America has often proved to be an interesting one. One of yesterday's posts was no exception. It mentions a revolutionary invention for decomposing rocks into individual mineral grains, a plasma discharge device, which was shown at the Goldschmidt conference in Davos a few years ago.

The poster reports that "The action is based on the fact that the electric conductivity is elevated on grain boundaries and a plasma discharge at 50 keV proved to break up a variety of rocks into single crystals. The rocks included a metamorphic shale (greenschist facies) with amphiboles, garnets, sulfides, etc; a marble broke into perfect calcite rhombohedra, sphalerite and galena crystals - an amorphous shungite delivered intriguing round graphitic aggregates plus much fine grained graphite."

Plasma discharge? Really? That sounds like something I heard about on Star Trek as a child, but would have assumed was naught more than "technobabble". It is kind of delightful to hear that such things really exist. I would love to see such a toy—what a great way to isolate garnets or monazite for further analysis. Though, sadly, one would lose all of the wonderful information available from in-situ analysis, perhaps the larger amount of statistical information to be obtained by getting all of the grains in the sample in their whole form might make up for that.

Thursday 4 August 2011

and the adventures continue

My mandatory holiday in Australia, wherein I applied for my visa to move permanently to Scandinavia to live with my partner, turned out to be only three weeks long. This was a long time to be separated from him, but only just long enough to accomplish what I wanted to with the trip. In between visiting with friends and family I managed to get what feels like a good draft of my paper from my PhD research written and handed in to my adviser for his edits/comments, and had some very good discussions with him about the research/experiments I did in Italy that will be useful when I return to finishing up the paper from that project. But before I do that it is time to enjoy the rest of my love's summer holiday with him, and go camping at the Medieval Week in Gotland. Time enough to return to being a scientist after indulging personal interests.

Friday 15 July 2011

How quickly we fall back into good habits

Working on my PhD project necessitated developing a number of good habits with regard to work patterns. Although it has been two full years (and a week or three) since I finished my thesis and got on a plane to start my first post doc position it turns out that some of my work habits from here are tied to the town, not just the house in which I lived then. Now that I am back in Tasmania I am finding it easy to pick up the pieces of that project and get back into "thesis mode", breaking the list of things that need to be done into tiny bits and working on them. Taking breaks to exercise, get food, and catch up with friends I have not seen in a couple of years, but still being way more productive than I have been in the past six months since that post-doc position ended, when I was on what is better described "vacation mode".

While it was a delightful vacation, I find that I am enjoying working on this project once again. Today I looked at thin sections of my samples in the microscope. The first thin sections I have seen in person since leaving (I had plenty of microprobe time analysing the experiments I did, but no actual rocks to play with). I would say that I had forgotten how pretty they are, but, really, I hadn't. I do have plenty of photos (and good ones!) of these samples, but there is something nice about being to rotate the stage and see the colours change.

Monday 11 July 2011

why you should publish before you finish your degree: a cautionary tale

When I completed writing my PhD thesis two years ago I boarded the plane the very next day to head off to my first post-doctoral position. Somehow, while I made a few attempts to write a paper based on that research during the 1.5 years of that post-doc contract, I didn't actually finish writing it—the first couple of drafts were still attempting to include too much information.

It will come as no surprise to anyone to hear that I continued to not work on that paper during the six months I was in Scandinavia on a visitor's visa living with my new-found love. Now that I have returned to Australia to submit my application for a permanent resident visa so that he and I may continue living together I have begun again, at long last, to working on that paper. One advantage to waiting until now is that instead of discussing the paper and the proper aims and scope thereof with my erstwhile adviser over email I can stop into his office and get real time interaction and feedback.

Today we had our first face-to-face meeting in two years, and he cautioned me that he expected that, given how long it has been since I have worked on this project, that it would probably take a good three days just to re-familiarize myself with what I was doing so that I could move forward on the project. How I wish that he weren't correct in that.

I recall having, on more than one occasion, cursed previous researchers who studied these rocks for the information that they left out of their theses or publications. Today I am cursing myself for what, now, appears to be a fairly random organizational system which has made it difficult to find the spreadsheets I need.

An additional complication I have encountered is my computer upgrade. I purchased a much-need new computer last October, and while I was able to replace most of the programs on it, it was not possible to replace my copy of ArcMap. This is the program in which I recorded the positions of each and every analysis point from every microprobe session I ever did during my PhD research. It is a wonderful program which permits one to accurately align photographs with x-y coordinates such that one can see at a glance where on each crystal each analysis point is located.

In the course of my research I exported the images for many of the samples to CorelDraw in order to create figures to be used in the thesis. I now wish to create a new figure for the paper I am working on, but the exported version contains the location of the analysis points for three out of four of the minerals used in the calculations. This means that I need to open the ArcMap files. I should be able to do this when next I am at the university, by using one of their computers, but it will require a bit of effort to explain to the program the new location of all of the files required.

So now the researcher who I find myself cursing for incomplete information is none other than my past self! There is no one to blame but me, each time I chose to do something other than writing this paper while the information was all still fresh in my mind I was also choosing to make the eventual writing of the paper just that little bit more difficult. I freely admit that, at the time I made those choices, it seemed like a reasonable price to pay, but now the time is nigh, and, indeed, it looks like it just may be a good three days to get back up to speed on this project so that I can finish it.

Wish me luck—as one of my colleagues pointed out to me today "research which is not published is wasted effort", and I do not wish all of that effort to have been wasted.

Friday 8 July 2011

Google+ for geologists

I am not certain if this is a good idea or not, but when a friend sent me a Google+ invite to my personal email address, I used that address to send an invite to the address attached to this blog. After all, this is the address that I keep logged in and have my GoogleReader geology feeds set up. Unlike the account associated with my personal email address, which had no suggestions of people I may know, this address came with a bunch of suggestions, several of whom I recognize as fellow geobloggers. Therefore I created a circle called "geologists" and added them to it. I have no idea if it tells you that you are now in my circle, but if it does you now know why…

It let me set up "sparks" for "metamorphic petrology" and "orogenesis", but they don't look like they have much information available at this time.

Sunday 26 June 2011

orogenesis

I have been far too busy enjoying the fact that I moved to Scandinavia for love to post very often, but I feel compelled to play in this month's Accretionary Wedge. My favourite geology word would have to be orogenesis. I love mountains better than any other land form, and the process of their formation is endlessly fascinating. The microscopic changes which happen in the metamorphic rocks at depth during mountain building are rich with information about the processes that built the peaks.

Friday 15 April 2011

Metaphorical rocks

I have been taking a language class since moving to Scandinavia so that I can learn to understand the local language. Last week we had a homework assignment to write about our new city, and there was an essay in the textbook that we could use as an example/inspiration for our own writing.

Being a geologist with little interest in cities my essay didn't look much like the one in the book, which focused on various tourist destinations in a major Scandinavian city. Instead I spoke about the fact that January was a good time to arrive here because then it is cold enough it doesn't rain, mentioning that I do not care for rain in the winter, but I love snow, and find the ice-crystal covered trees much prettier than bare trees. From there I went on to discuss the interesting people I have met, and ending with a paragraph explaining that I am looking forward to summer because then I will be able to see the rocks; I have been told that the local rocks are ______, and that is the prettiest rock type.

The word I had in that blank was meant to be "metamorphic". However, when I asked my favourite on-line dictionary for the local word for "metamorphic" it didn't know the word, so I instead called upon Google Translate, which helpfully provided me the word "metaforiska", so I used it. However, when the teacher returned my essay she wrote on the page "metaphorical? Is that really what you meant?" Oops! Checking Wikipedia the local language it turns out that the word I should have used was metamorfa.

However, when I think of it further, it occurs to me that, perhaps, I did choose the correct word after all. Metamorphic rocks, can, indeed, serve as a metaphor for life. In this world we are born as soft, yielding creatures (babies = ocean floor sediments). Over time we are subject to heat and pressure ( = rules from parents & society) which gradually transform us into first older children (phyllite) and then teenagers (low grade schist) and finally mature adults (high grade schist, mylonite, or even migmatite) with the record of our experiences both moulding who we are as people and leaving a permanent record in our souls (zoning in porphyroblasts, inclusion trails, flow banding, etc…) The more difficult the life, the more character we develop, and the stronger we need to be (which is why the prettiest rocks are the ones which are most deformed).

Friday 1 April 2011

links to other blogs

I just read a wonderful series of posts by Life in a Plane Light describing how metamorphic reactions turn boring old mud into beautiful garnet schist. If anyone missed it, part one talks about the factors that make up metamorphism, the second talks about the first changes that happen to the mud when heat is applied, and the third adds deformation into the equation and gets us to the garnet. If you haven't read them yet they are so worth a look.

Thursday 31 March 2011

slickensides vs slickenlines

In my current job I am learning any number of interesting things as I look things up in the course of editing so as to be certain that terms are being used correctly. Today's noteworthy subject to look up is the difference between the terms "slickensides" and "slickenlines". I only recall the former from my undergraduate structure courses, and neither term has come up in my own research since then. There was a time when looking up such geologic terms meant reaching for a geologic dictionary. These days it can sometimes be more effective to reach for the internet. I just found an interesting article which nicely clarifies the difference between the two words, and why there are two such closely related words in the first place.

Slickensides refers to the planar, polished, surface of a fault plane (the polishing occurring when the rocks rub past one another. Slickenlines, on the other hand, refers to the liner scratches which occur on such a surface, as a projection on one side of the fault scratches a grove onto the other. Most of the slickensides I have seen in the field contained slickenlines. No wonder my teachers and classmates simply used the term "slicks" when discussing them informally in the field.

Wednesday 16 March 2011

What an effective way to learn!

I recently replied to an advertisement looking for people to do editing of geoscience journal articles. They first sent me a one page test document to edit to see if they were happy with my ability as an editor, and when I passed that exam they sent me an actual article to do. What a fun assignment! In order to properly edit a sentence one must understand what the writer intended to convey, and in order to do that one must understand the context—what procedures did the author carry out, what were the results, and what do they think it all means? I have written before about "active" reading, and the advantages that can give one in understanding the content of a journal article. It turns out that for me I am able to get even more information out of an article when I edit it, one sentence at a time. I have sent the first article back; I really hope they like my work with it and decide to send me more. I have so enjoyed learning the topic of this paper that I wish to do it again with other papers.

Wednesday 9 March 2011

what goes into making a thin section before we can do optical mineralogy?

There has been a lively discussion on the MSA-Talk e-mail list the past few days on the subject of optical mineralogy. Life in a Plane Light has a very nice summary of the discussion and an update of other posts that came in after the first summary.

I have been following the conversation with interest because optical mineralogy is very important to metamorphic petrologists. For those of you who are not familiar with the process a brief description is in order. Step one is to obtain an interesting rock from the field—break off a hand-sample from the outcrop (a chunk of rock small enough to carry in your hand), record on your map the location from whence it was obtained, and write down any important observations you have made about the outcrop (how large is it, does it contain more than one rock type? What sort of contacts separate the rock types? What structures are present? If your sample has any structures which are measurable (foliation, lineation, strike & dip of the rock itself) measure them *before* obtaining your sample, and make marks on the rock with a waterproof marker showing what you measured and what the measurements were—then carefully break that portion of rock away from the outcrop without destroying the marks.

Why is step one so important? Because knowing the field relationships of your sample really helps your understanding of what you will see in the thin section once you have it.

Step two is the creation of the thin section. To do this we use a rock saw to cut the hand sample open. If there are structures of interest in the sample (foliations, lineations, etc.) it is important to make the cut at an angle of interest. There are times when one wishes to see the minerals parallel the structure, times when one wishes to the minerals perpendicular to the structure. If the structure is complex one will likely wish to make more than one thin section of the rock at more than one angle.

We use the saw to cut a small rectangular block of rock out of the hand sample, with one of the long sides of the rectangle oriented in the direction of interest. If your sample is an "oriented" sample (it has marks on it showing what was measured in the field) take care to transfer those marks onto the small block so that you will know which way is "up" or "east" or "north", or whatever orientation you have marked. Once the hand sample is a small block we polish one side of it (the one which is oriented in the direction of interest with respect to the structure) and when it is very smooth we "glue" that side to a glass microscope slide (using a rock appropriate epoxy). At this point we record the sample name on the glass, and also transfer any marks showing the orientation of the sample to the glass itself (this can be done low-tech by scratching on the glass with a nail, or high-tech by using a laser, or with a few other options in between of intermediate technology levels) After the epoxy has set we use a rock saw to cut away most of the rest of the block of rock (which we save for later comparison with the thin section—it can be helpful to also polish the face of this block that was closest to the glass before removing it).

The next step is to polish the thin layer of rock which is attached to the glass slide. This is done carefully because at the end of the process we wish the layer of rock remaining attached to the slide to be only 30 microns thick (remember that there are 1000 microns in every millimetre). The reason we wish it to be that thin is because at this thickness many of the rock forming minerals are translucent—light will pass through them.

This is where the "optical mineralogy" part really begins. By using a petrographic microscope we can see and identify the minerals in the sample and see their relationship to one another. How do we do this? By carefully comparing the various features we can see with an understanding of the features usually displayed by minerals. A course in optical mineralogy teaches us how to distinguish one mineral from another based on their colour or lack thereof, how high is their "relief" (does it appear to stand up above the plane of the glass slide, appear to be lower than that plane, or more or less lie in the plane?), what is its crystal habit of each of the minerals? All of these clues, taken together, permit us to recognize the minerals.

Once we know which minerals are present we can then make observations of how they relate to one another. Are they all aligned with their long axis parallel to the same direction (foliated)? Is that alignment a planar feature, or is it folded? Is there more than one foliation? Are some minerals present only totally surrounded by (included within) certain other minerals? When minerals are present both as inclusions and within the matrix is there any difference between them? (are the inclusions smaller or larger than the same mineral in the matrix? Are they oriented the same direction in both locations? Is there a colour change from one to the other?

These are just a few of the things we look for in a thin section to help unravel the story of the rock. When I was an undergraduate student we not only had a dedicated course in optical mineralogy, but it was a requirement of the course to make one thin section ourselves, starting from collecting the sample in the field and ending with a report about all of the minerals present in the sample and their relationship to one another and what we learned about the rock thereby. In those days we had to make a drawing of the thin section which showed these relationships.

Now days we have fancy, high-tech optical microscopes with motorized sample stages that are attached to powerful cameras and computers. As a result we can program the machines to take a series of photographs at very close scale of thin section, then "stitch" them together to make a single high-resolution image of a large portion of the thin section, which we can then annotate in a drawing program, labelling the minerals, tracing the structures, etc. For those of us who are not practiced artists this is a much better approach for illustrating what we see in the thin sections. However, in the old days a talented petrologist with a steady drawing hand was able to do drawings of thin sections which are works of art and which show an amazing amount of detail of what is in the sample. For a good example of this check out the book Metamorphic Textures by Alan Spry, published in 1969 (ISBN: 0080133169 / 0-08-013316-9), which appears to be available for purchase in pdf form these days, though I haven't tried to do so.

Monday 28 February 2011

serendipity

I have been in Scandinavia for two months now, and this weekend I decided that it was time to see if I could learn anything of the local geology on line, since the rocks are still too snow covered to be revealing many of their secrets to my own observations. So I called upon Google, as you do in such situations, and requested information on "Luleå geology". Much to my surprise the first hit was an announcement of a faculty position at the local university, the one within walking distance of my new home. They are looking for someone to teach ore deposit geology and conduct research on that topic. The translation of their ad says that this means that one uses "geochronology, isotope geochemistry, tectonics, structural geology, mineralogy, etc. to explain and describe the processes by which metals are transported, concentrated and precipitated".

This description made me smile; while I have not focused upon ore deposits in my own research their list of tools used is pretty much a one to one match to the list of research interests/tools on my CV. Reading the fine print of the ad I see that previous experience in research on the topic of "malmkaraktärisering" (ore characterisation) is "meritorious", rather than "required". This, too made me smile; I may not have done much with ore deposits myself, but I am a graduate of CODES: the Centre for Excellence in Ore Deposit Research at the University of Tasmania—all of the short courses and most of the seminars I attended were on ore deposit research of one sort or another, often sharing very cutting edge research or technological applications. Therefore, while I may not have the "meritorious" advantage of having done my own research on the subject, I have absorbed a fair bit of information on the topic over the years, and have a good idea of which colleagues to turn to if I have questions on any particular topic in the field.

While writing the application (read: taking information from my CV and inserting it into their template) I thought about what to put into the "future research" section of the document. This caused me to recall a particularly interesting seminar talk while I was still at CODES, so I e-mailed the speaker and let him know that I was preparing the application and would be interested in doing collaborative research using that technology should I be the successful applicant. Much to my delight I received an encouraging reply in plenty of time to include his name in the application. He also reminded me that the honorary doctorate degree he'd received a couple of years back happens to have come from this university. I am taking this as a positive sign, and happily turned in my application this morning (today being the application deadline—I saw the ad only just on time!).

I have no idea how I will do with this application—it matters as much what the other applicant's packets contain as it does what I have included in my own, but I am confident that should I be the lucky winner in this case I will be able to do the job, and do it well. How lovely it would be to be able to work in the town I have chosen for personal reasons. However, if it doesn't work out I am certain that I will enjoy whatever path I do take…

Thursday 10 February 2011

too busy too be bored; too happy in the north to want to move south

I have some friends who are unemployed and looking for work who complain on certain social media sites that they are bored. My contract ended with the end of December, so, technically, I am also unemployed, but I am far, far too busy to be bored (as people might be able to guess if they compared frequency of my posts before and after the contract ending).

What am I doing to keep busy? I'm getting close to done processing the data I generated during the last couple of weeks before I left; I should be able to actually begin the writing process within a week. I'm settling into a new home with a new partner in a new country, and trying to learn a new language. Our evenings are full with folk dance classes, choir practice, gaming with friends, visiting a local climbing wall, martial arts practice, and, of course Medieval Re-enactment. My days are full with finishing up my last research project, trying to keep up with personal correspondence, studying my new language and attending class for that, dealing with the bureaucracy at the Uni (why do they need copies of my highschool, BS, and Master's transcripts before they approve my enrolment in a beginning language class when they have my PhD transcripts? (Doesn't the one sort of imply the existence of the others?) I am also starting the paperwork for appropriate visas to actually be able to stay here.

I'm also continuing the job search, but now that there are two of us to consider I'm being a bit fussier about the jobs for which I will apply—I have never been interested in hot climates, but had been applying for interesting sounding jobs located in such places anyway, with the thought that I could endure hot weather for a short time and then when I have more experience move on to someplace with good weather. Now that I'm happily living somewhere far enough north to have real winter I am much less inclined to consider locations without winter, and my partner, like me, loves the snow and cold weather.

I listen to friends who live in more southern locations complain about winter—that it is cold, dark, wet, and depressing. I am convinced that the reason they think this is because they are too far south. Up here in the north (though still south of the Arctic Circle) winter may be cold, but it isn't wet, and it isn't dark or depressing. Instead the snow reflects light beautifully, making even overcast days brighter than their counterpart down south. And day, like today, when there are no clouds, are sometimes overwhelmingly bright. Yes, the sun does set early, but we are living in a town, which means that there are street-lights, which means that the snow is reflecting that light all night long, so visibility is good and it is neither dark, nor depressing.

I have been saying for a decade that I really miss real winter. Now that I have it again I don't wish to move somewhere without it. Now for the fun part: either finding an academic job which will let me do interesting research and live in the north (but with mountains, too, please!), or obtain funding which will let me choose my own location to live and do research…

Friday 28 January 2011

Siccar Point revisited

Some time back I shared my photos of Hutton's famous unconformity at Siccar Point, Scotland. Yesterday Chris over at Highly Allochthonous shared a video he made which gives one a much better view of the unconformity than still photos. Thanks Chris!

Sunday 23 January 2011

dating one's research

I don't normally read on-line comics, since I tend to have too many things to read in the way of e-mail, friends posts to their facebook, livejournal and blogs. However, today one of my friends sent me this link from the PhD Comics, and I thought it worth sharing with others. Having done a thesis kind of recently I really understand what the author is saying. Yes, yes indeed, one really does get *that* close to one's research project...

Wednesday 19 January 2011

on musicians, Phd's, and following one's dreams

I should be working, but instead I have been enjoying catching up on reading various social networking sites and some blogs I follow. Today's highlight is a guest post on FSP's blog written by an MSP she knows. It is a very good comparison between the life of a graduate student with the life of a musician. It was written in response to those folk who say that doing a PhD is a waste of time. In that respect I don't know how effective it will be; perhaps those same folk will also think that being a musician is a waste of time. Be that as it may, I enjoyed the comparison. To my mind any life which follows one's personal interests and passions and encourages one to strive to better oneself in one's chosen field(s) is a good thing!

Ok, now it is time to close my web browser, open those files I was working on before heading north at New Years and see if I can find exactly the right words to describe the research with which I was occupied for the past 1.5 years so that I may share it with the world via a journal article…

Friday 14 January 2011

fablous fold photos on line

For those of you who missed today's Friday fold photos you might want to go click on this link and spend time admiring the really pretty folds from the new Structural Geology textbook by Haaken Fossen at the University of Bergen, Norway. If the book is half as nice as the on-line photos from it it would be a wonderful addition to any library.

Wednesday 12 January 2011

Photos from my Schnaels Valley trip last September and again in October

Back in early September I took a week off of a busy schedule attending academic geology conferences and short courses to attend the Second Annual European Textile Forum—a conference designed for both academics and living history enthusiasts who are interested in historic textiles. As a long-time participant in historical recreation events who loves hand-sewing and is fascinated with ways in which fabric and other textiles are created I really enjoyed the chance to meet and mingle with others who also love the subject. As with the textile forum of the year before, I reveled in living in a historic setting—this time we were at the Archeoparc in the Neolithic, surrounded with tools found with Otzi, the Ice Man.

However, for me the wonderful people met and the sharing of information on any number of textile arts was only part of the joy in the week; the rest of the joy was the setting itself. The Senales valley is a place of beauty, and it was fun to get out and look at bit at the rocks. I so enjoyed my week there that I returned again in October when my mother was visiting and did some more exploring. Here are some of the highlights of the geology I saw in my explorations of this valley in the Italian Alps.

One of the cute little farms in the lower part of the valley:


And the near-by outcrop:


The view above the Archeoparc historical buildings:

The church just downhill from the park (and some nice outcrop to the left):


Much of the rock of the part of the valley where we were staying is a lovely fine-grained schist:


In places the locals use the rock to form part of their storage sheds:

In other parts of the hiking trail up the valley it is just a pretty part of the landscape:


Not far uphill from the Archeoparc there is a damn which holds back a cute mountain lake, though I'm told that there are people who are still annoyed about losing their family farms when it was put in.

The schist gets coarser as one works one's way further uphill towards the ski resort:


In places there are some lovely quartz boudins:


I saw some pretty clear contacts:


In October there was already some decent snow on the peaks; I wonder how it looks now?